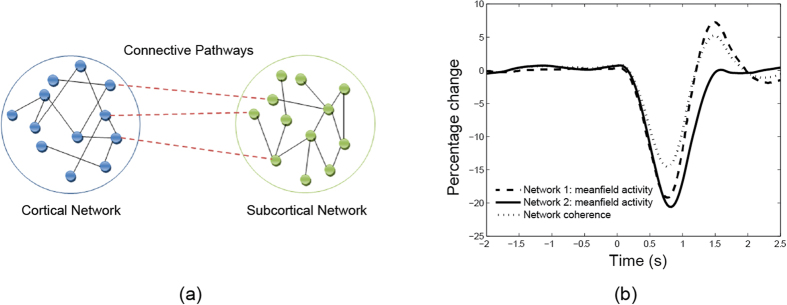
Figure 6.
(a) Schematic illustration of the interaction between two neuronal populations. The neurons for each network are interconnected, with additional connections between the two networks. Such a network can provide a model describing the interaction between cortical and subcortical regions of the brain. (b) Simulated mean field activity (e.g. LFP) for two coupled networks of neurons. Coherence and power are high during idle period followed by a drop during movement.

