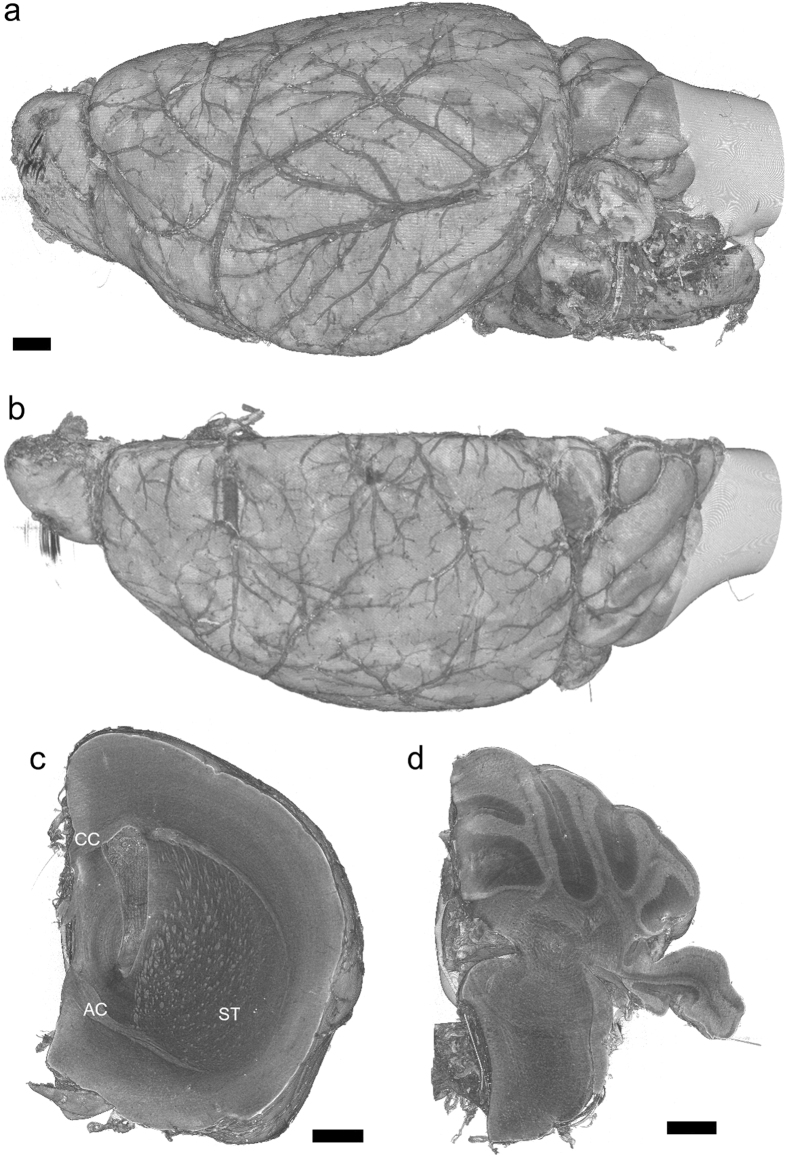
Figure 1. Three-dimensional rendering of left hemisphere of murine brain.
Linear attenuation coefficients from 0.3 cm−1 to 3.5 cm−1 were rendered with gray scale. Scale bars: 500 μm. (a) Side and (b) top views of the entire hemisphere. (c) Coronal cutaway at mid-cerebrum. Corpus callosum (CC), anterior commissure (AC), and striatum (ST) structures appear as regions with high attenuation coefficients. (d) A coronal cutaway at the cerebellum. The high coefficient regions are granular layers. These are representative images of five hemisphere samples.

