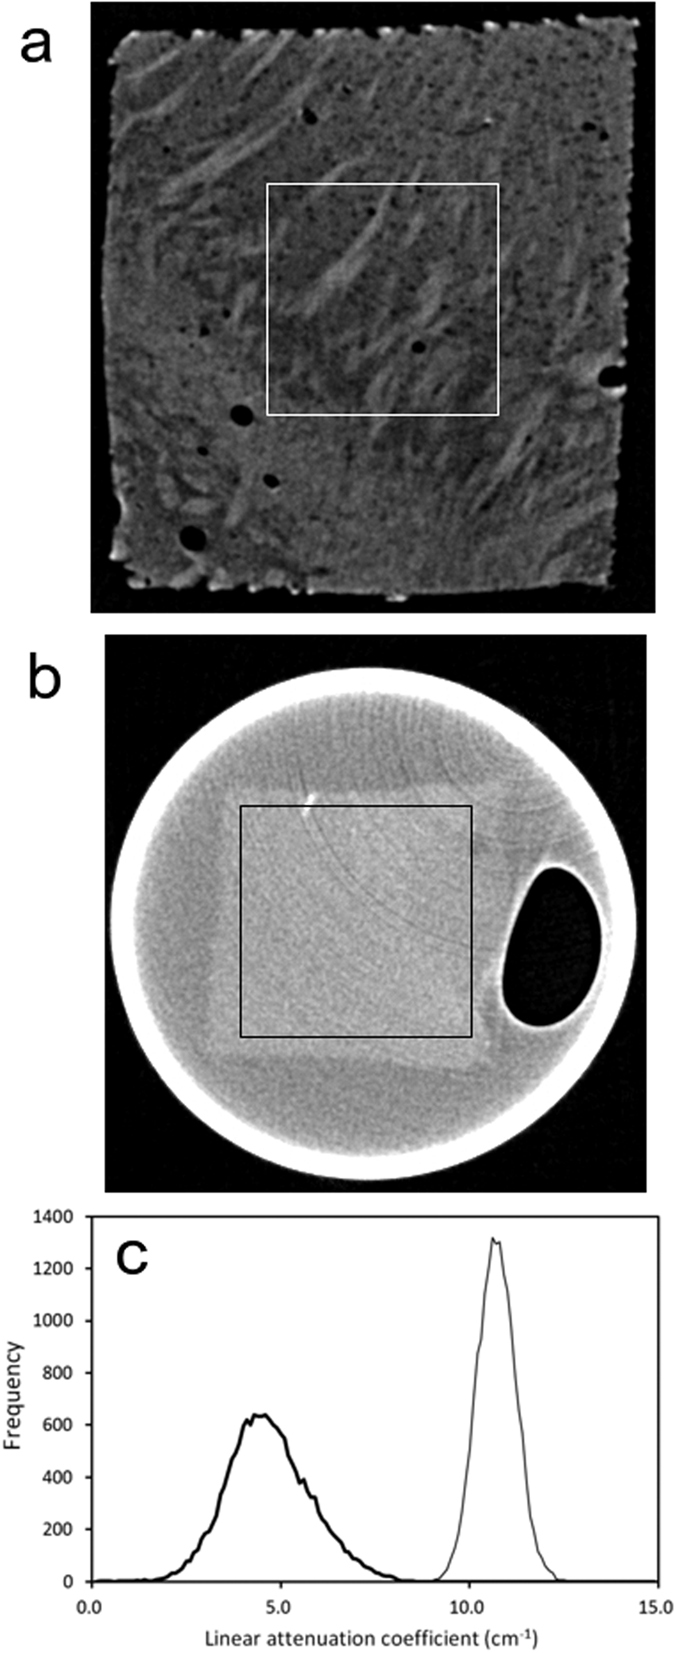
Figure 5. Tomographic sections of the striatum of freeze-dried and resin-embedded tissue samples.

Linear attenuation coefficients from 0 cm−1 to 15 cm−1 are gray-scaled. Boxes with dimensions of 360 μm × 360 μm indicate the areas used for plotting the histograms. (a) Section of the freeze-dried sample. (b) Section of the resin-embedded sample. (c) Attenuation coefficient histograms. The number of pixels in each 0.1 cm−1 bin is plotted against the attenuation coefficient. The thick line represents the results of the freeze-dried sample, and the thin line shows those of the resin-embedded sample.
