
Figure 6. Tomographic sections of the striatum of the freeze-dried sample visualized with a 0.5-μm voxel width.
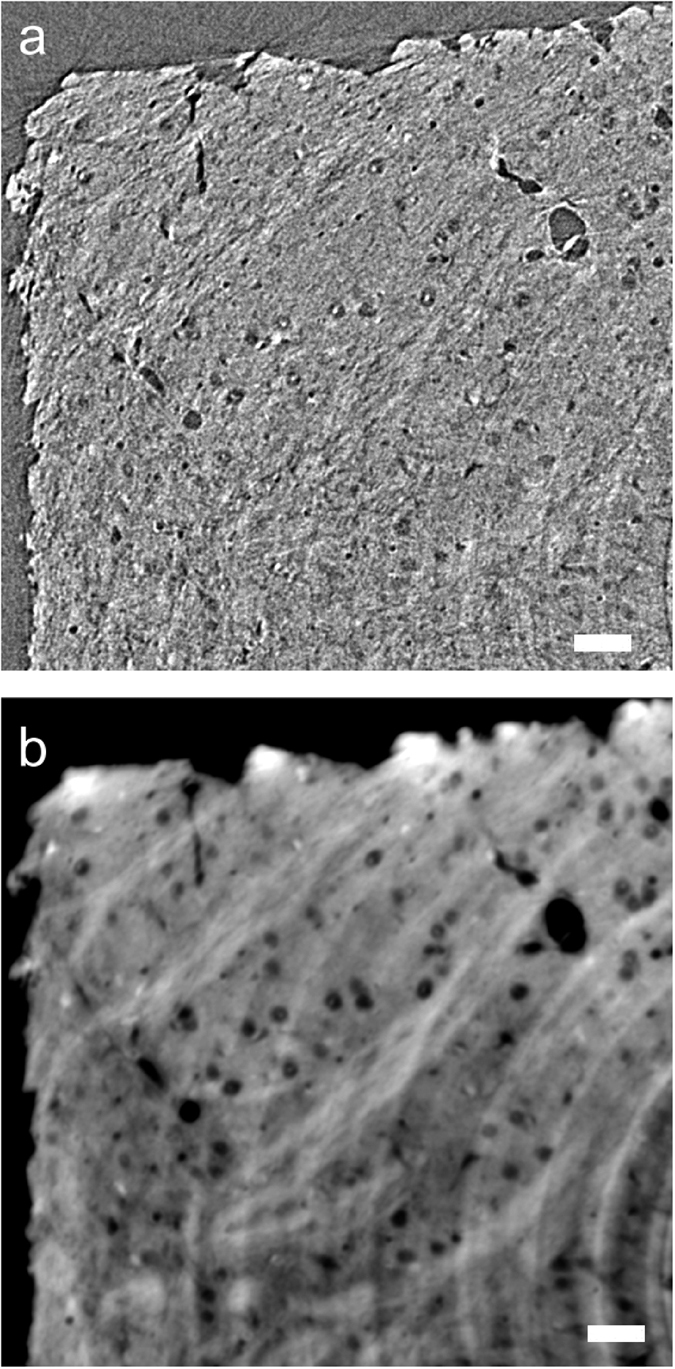
These images approximately correspond to the upper left corner of the section shown in Fig. 5a. Scale bars: 25 μm. (a) Absorption-contrast tomographic section. Linear attenuation coefficients from −15 cm−1 to 15 cm−1 are gray-scaled. (b) The same section reconstructed with the phase retrieval method. Arbitrary gray scale.