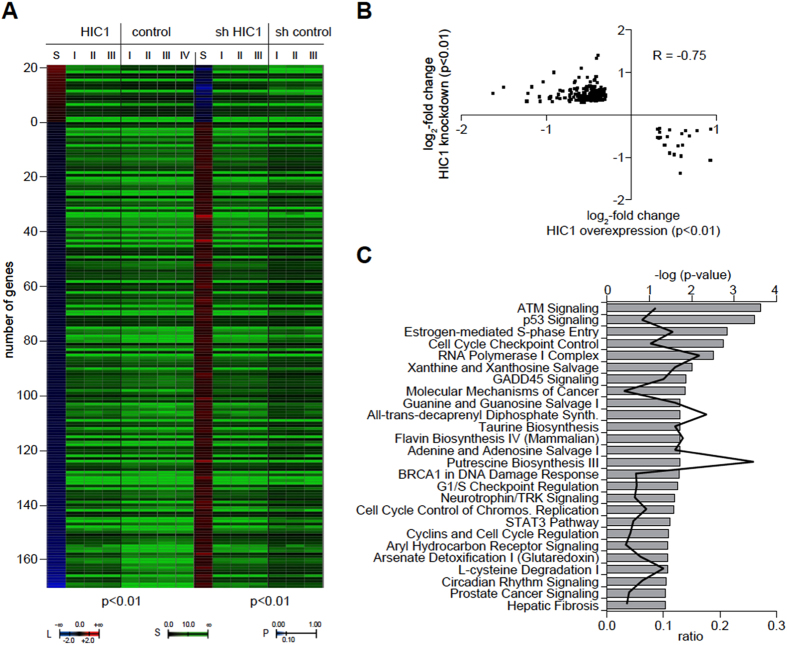
Figure 2. Identification of HIC1 target genes.
(A) Heatmap of statistically significantly (p < 0.01) concordantly regulated genes upon overexpression (HIC1) and knockdown (sh HIC1) of HIC1. The number of positively regulated genes (L, red shading) and negatively regulated genes (L, blue shading) is shown together with independent biological replicate signals of each condition and control (S). Post-hoc p-values are indicated as color code (P). (B) Scatter plot of the genes shown in (A). The log2-fold change upon HIC1 overexpression is plotted against the x-axis, the log2-fold change upon HIC1 knockdown is plotted against the y-axis. The Pearson correlation coefficient is indicated (R). (C) Gene ontology pathway enrichments based on the genes shown in (A). Pathways significantly (p-values as indicated) enriched for HIC1 target genes are listed and the ratio is indicated.

