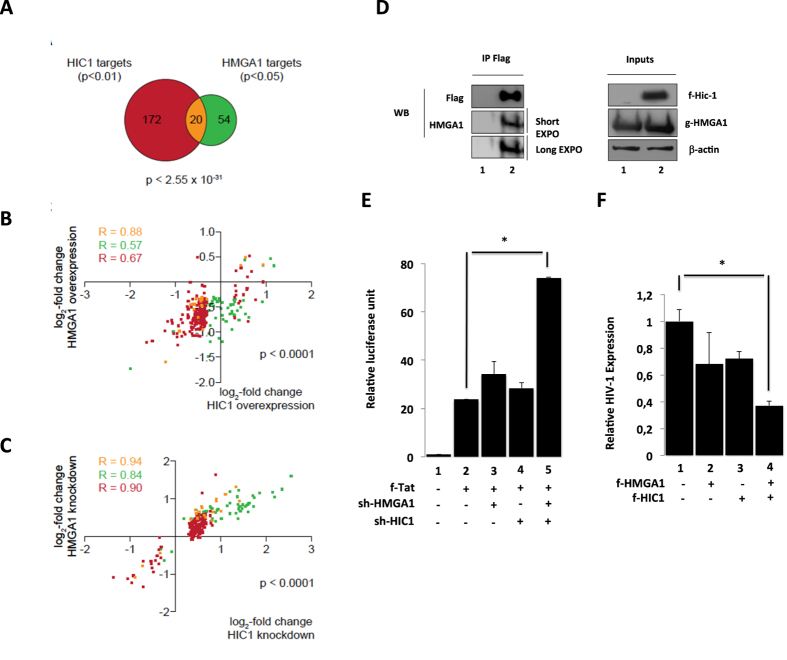
Figure 9. Cooperativity of HIC1 and HMGA1.
(A) Venn-diagram of HIC1 and HMGA1 target genes. HIC1 target genes (red) have been identified as indicated in Fig. 1A and HMGA1 target genes (green) have been defined as genes statistically significantly (p < 0.05) concordantly regulated genes upon overexpression and knockdown of HMGA1. The common subset is shown in yellow. The p-value (hypergeometric distribution) for chance occurrence of this overlap is indicated. (B) Scatter plot of the genes shown in A. The log2-fold change upon HIC1 overexpression is plotted against the x-axis, the log2-fold change upon HMGA1 overexpression is plotted against the y-axis. The Pearson correlation coefficient for each gene set is indicated (R). (C) As in (B) but comparing the log2-fold changes in gene expression upon HIC1 knockdown with the knockdown of HMGA1. (D) HMGA1 and HIC1 interact physically: HEK293T cells were transfected with the GFP-HMGA1 expression vector and the Flag-HIC1 expression vector (lane 2) or the control pCDNA3-Flag vector (lane 1). Complexes immunoprecipitated with the anti-Flag antibodies were immunodetected for the presence of Flag- HIC1 and HMGA1 proteins by Western blot as indicated. (E,F) HIC1 cooperates with HMGA1 to repress HIV-1 gene transcription and viral replication: Microglial cells were transfected either with the episomal pLTR-luciferase reporter (E) or the pNL-4.3 provirus (F) and the indicated plasmids. 48-hours later, cells were lysed (E) or supernatants were harvested (F). Relative HIV expression was measured through the titration of the viral p24 concentrations in supernatant and normalized relatively to their appropriate empty vector control (F). Cell lysates were subjected to luciferase assay, normalized with the renilla luciferase system and expressed as relative value with their respective control (E).

