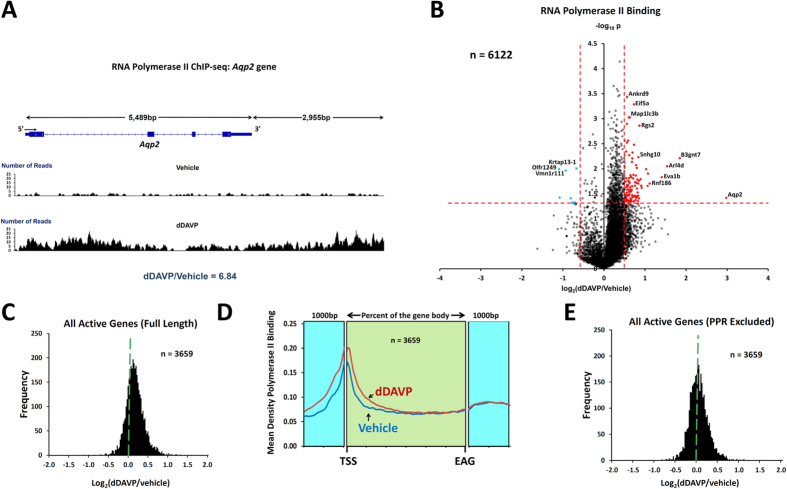
Figure 2. RNA Polymerase II ChIP-seq.
(A) Mapped reads for typical RNA Polymerase II ChIP-seq samples show increased Polr2a binding to Aqp2 gene. Reads for a single pair of samples are mapped to exon-intron structure of gene for vehicle-treated cells (above) and dDAVP-treated cells (below). In this example, the dDAVP:Vehicle ratio is 6.8 (unnormalized reads mapped to gene body). (B) Volcano plot for RNA Polymerase II ChIP-seq data for top 6122 genes shows marked asymmetry. More genes show increased RNA Polymerase II binding with dDAVP than show decreased binding. The horizontal axis shows the mean log2(dDAVP/Vehicle) for 3 pairs of samples. The vertical axis shows –log10P for t-tests for each gene. Vertical dashed lines show 95% confidence interval for random variation based on Vehicle:Vehicle comparisons (2 × SD). The use of two selection factors represented on x- and y- axes provides stringent identification of vasopressin-responsive transcripts in upper right (red points) and upper left (blue points). (C) Histogram for dDAVP:Vehicle ratio for RNA Polymerase II binding shows a median value >0 (dashed green line). Values were from the 3659 genes with successful measurements in all RNA-seq and ChIP-seq samples. (D) Composite tracings for dDAVP and Vehicle showing average RNA Polymerase II read densities over all gene bodies from TSS (transcription start site) to EAG (end of annotated gene). Difference in Polr2a binding is apparent only at 5′-end. Data are also plotted for 1000 bp upstream and 1000 bp downstream from gene body for comparison. (E) Histogram for dDAVP:Vehicle ratio for RNA Polymerase II binding to gene bodies beyond the +400 position (relative to TSS) shows a median value ~0 (dashed green line).

