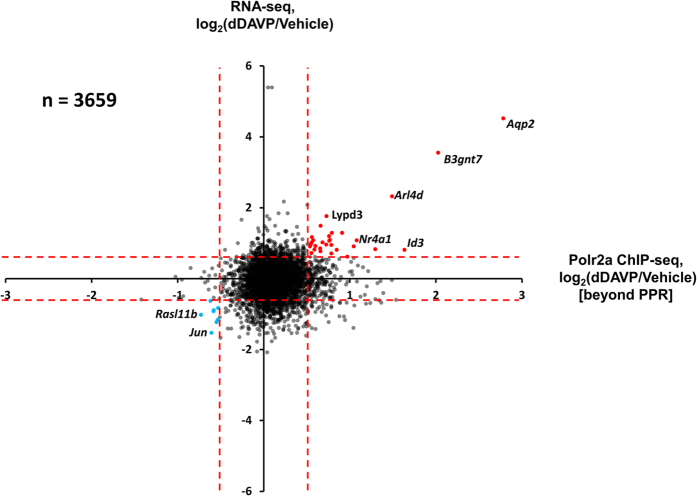
Figure 5. Scatterplot, showing log2(dDAVP:Vehicle) values for RNA-seq versus log2(dDAVP:Vehicle) values for RNA Polymerase II binding to gene body beyond the promoter proximal region (PPR) shows net transcriptional regulation for only a few genes including Aqp2.
Dashed red lines indicate 95% confidence for Vehicle:Vehicle comparisons as indicated in Figs 2D and 3B. Red points indicate upregulation by vasopressin. Blue points indicate downregulation. All regulated genes are listed in Tables 1 and 2.

