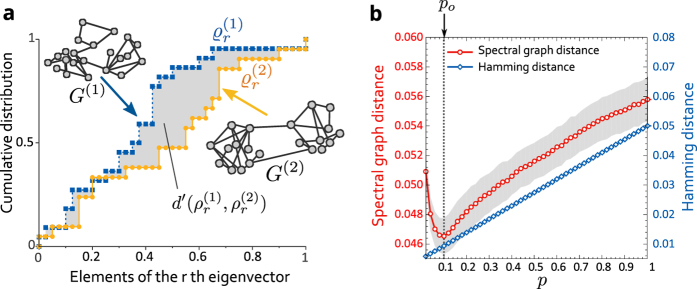
Figure 1.
(a) Schematic diagram of the spectral graph distance described by Eqs (3) and (5). The distributions  and
and  are obtained from the rth eigenvectors of the Laplacian matrix L(1) corresponding to the network G(1) and L(2) corresponding to G(2). (b) The spectral graph distances and the Hamming distances between the networks G(po) and G(p) generated from the WS model, where the value of p is varied and po takes the fixed constant value (po = 0.1). The number of nodes N = 500, and each node has on average k = 10 links. The grey area indicates ± standard deviation.

