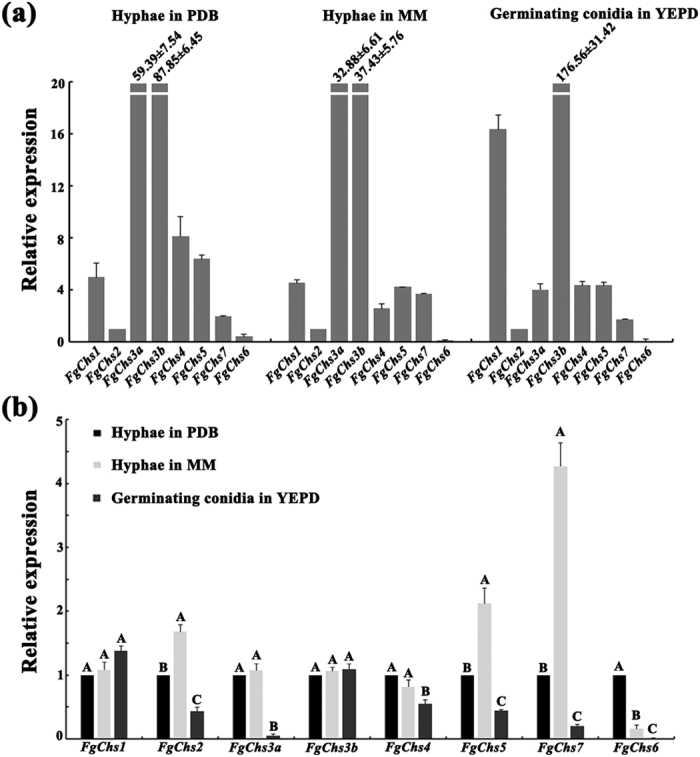
Figure 2. Expression profiles of eight FgChs genes assayed by qRT-PCR.

RNA samples of the wild-type PH-1 were isolated from vegetative hyphae grown in PDB or MM, and from germinating conidia cultured in YEPD. The relative expression level of individual FgChs gene was analyzed with the 2−ΔΔCt method with the ACTIN gene as the internal control for normalization. (a) Comparison of the transcript abundance of eight FgChs genes in hyphae grown in PDB and MM, and germinating conidia cultured in YEPD. The expression level of FgChs2 was referred to 1. (b) Comparison of the transcript abundance of individual FgChs genes in hyphae and germinating conidia. The expression level of each FgChs gene in vegetative hyphae grown in PDA was referred to 1. Mean and standard errors were determined with data from three independent replicates. Values on the bars followed by the same letter are not significantly different according to a least significant difference (LSD) test at P = 0.05.
