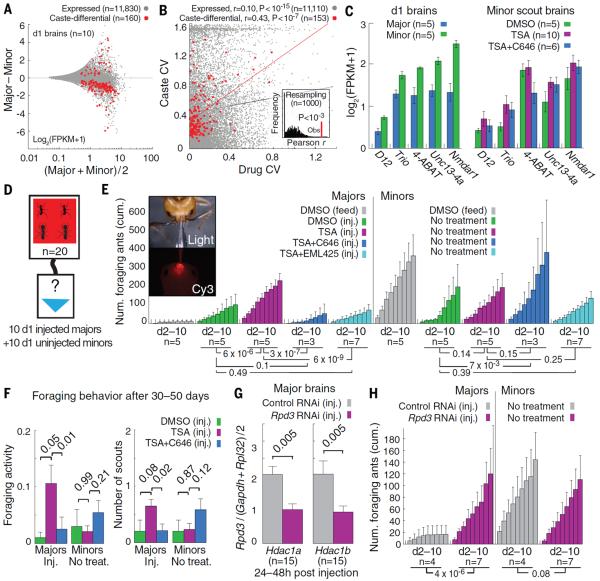
Fig. 5. RPD3 and CBP mediate epigenetic reprogramming of major workers.
(A) Differential versus average scatterplot comparing mRNA levels for brains dissected from individual 1-day-old majors and minors (n = 5 per caste) from one colony. Caste-differential genes were identified by Mann-Whitney U test (P<0.05) and gene-specific SE (Bonferroni P<0.01). (B) Scatterplot comparing coefficients of variation (CVs) in gene expression between drug treatments and caste. Pearson correlation coefficients are shown. Inset shows correlation coefficients for 1000 random sets of 153 genes sampled from 11,110 expressed genes. (C) mRNA levels for select caste-differential genes in 1-day-old worker brains (left) and minor scout brains (right). Error bars denote SE among biological replicates. 4-ABAT, 4-aminobutyrate aminotransferase; Unc13-4a, mammalian uncoordinated homology 13, 4a ortholog. (D) Schematic of piggyback foraging assay. Majors and minors received no injection (gray) or 0.5% DMSO, 50 μM TSA, 50 μM TSA + 100 μM C646, or 50 μM TSA + 100 μM EML425 and were placed in a nest box attached to a foraging arena with 20% sugar water (blue triangle) (Fig. S1E). (E) Cumulative foraging over the course of 9 days for pooled cohorts of minor and major nestmates, measured by time-lapse photography every 6 min. Uninjected cohorts were fed 20% sugar water containing 0.5% DMSO. Error bars denote SE over replicate cohorts. See table S5 for colony background and mortality information. Photographs (and movie S2) depict brain injection procedure. P values were estimated by Mann-Whitney U test using counts of daily foraging events. (F) Long-term assessment of foraging activity (left) and number of scouts (right) for the same injected majors and control minors from (E). (G) RT-qPCR analysis of mRNA abundance for Rpd3 (Hdac1a and Hdac1b) in major brains 24 to 48 hours after injection with nontargeting (control) RNAi or Rpd3 RNAi. Each bar indicates the mean ± SE over measurements from 15 brains. Abundance was normalized against Gapdh1 and Rpl32. (H) Cumulative foraging over the course of 9 days for pooled cohorts of minors and majors, as in (D). P values in (E) to (H) were computed by Mann-Whitney U test.

