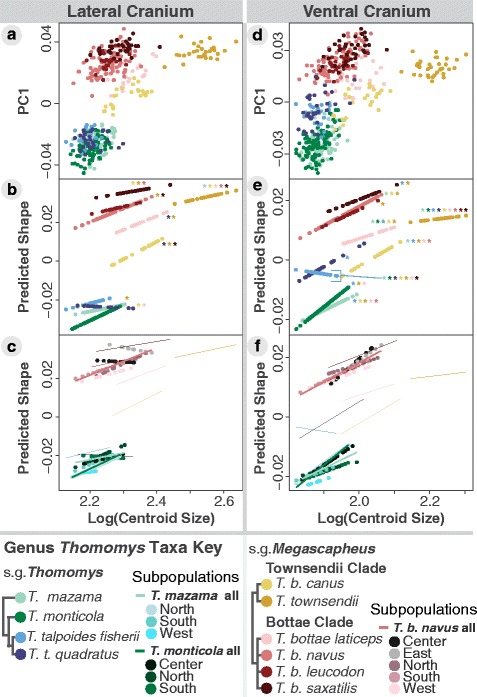
Fig. 4.

Taxa-specific cranial allometric slopes as a function of centroid size. Centroid size is a proxy for body size. a and d show PC1 versus centroid size for lateral and ventral cranial views, respectively. The remaining graphs b, c, e, f use the first principal component of the predicted shape scores from the multivariate regression against log-transformed centroid size (after [53]). The bottom graphs c and f show the variation in allometric slopes within regional subpopulations sufficiently sampled to be comparable to the species and subspecies slopes from b and e, respectively, shown as lines to reduce visual clutter
