
Fig. 2.
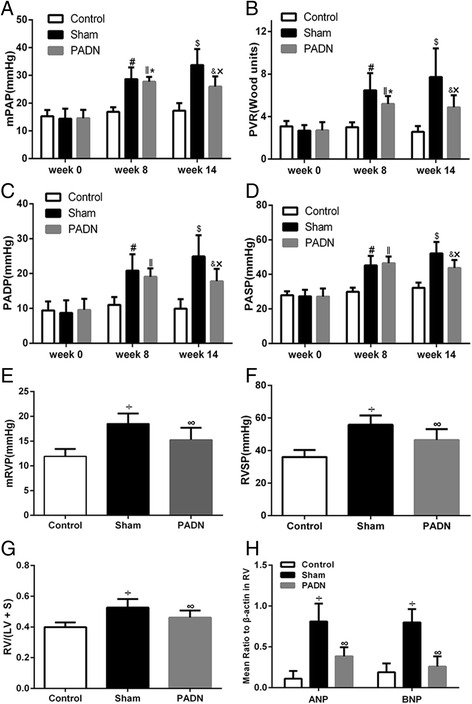
Hemodynamic parameters and RV function in three groups. PADN reversed the development of PAH, demonstrated by the decrease of mPAP (a), PVR (b), PADP (c) and PASP (d). Meanwhile, PADN improved RV function, demonstrated by reduced mRVP (e), RVSP (f), RV/(LV + S) (g), ANP and BNP (h). # P < 0.05 compared with the control group in week 8. ‖P < 0.05 compared with the control group in week 8. $ P < 0.05 compared with the control group in week 14. & P < 0.05 compared with the control group in week 14. * P < 0.05 compared with the PADN group in week 14. ×P < 0.05 compared with the sham group in week 14. ÷ P < 0.05 compared to the control group. ∞P < 0.05 compared to the sham group