
Fig. 4.
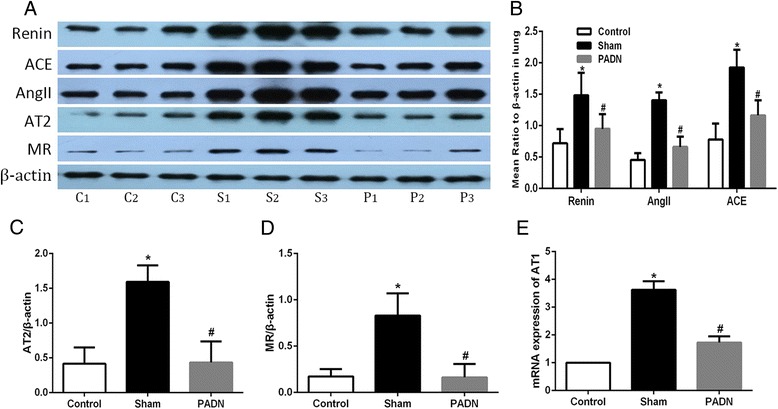
Influence of PADN on the pulmonary RAAS activity. PADN inhibited the local RAAS activity in lung tissue. a Representative western blot images of renin, ACE, AngII, AT2, MR and β-actin in pulmonary tissue. b–d Bar diagram showed intensity data of western blot images, all data were normalized by β-actin. e Bar diagram showed data of mRNA expression of AT1 receptor in three groups. C1, C2, C3 : contol group; S1, S2, S3 : sham group; P1, P2, P3 : PADN group. *P < 0.05 compared to the control group. #P < 0.05 compared to the sham group