Figure 4.
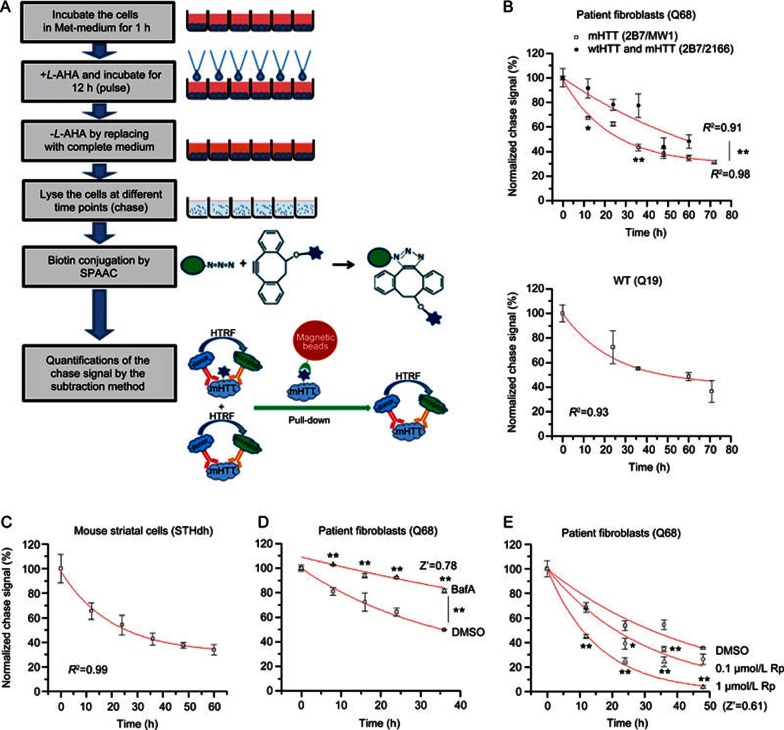
Measurement of mHTT degradation and its modulation. (A) Schematic picture of the high-throughput-compatible CH-chase assay. (B) The degradation curve measured by CH-chase in HD patient fibroblasts (Q68, upper panel) and the control patient fibroblasts (Q19, lower panel). Mean±SEM; n=4; R2 indicates the regression coefficient of the curve fitting using the exponential decay function (Y=Ae-X/t). Both mHTT degradation (2B7/MW1) and total HTT degradation (2B7/2166) have been measured in the Q68, and the mHTT degradation is significantly faster; (C) Similar to (B). The degradation curve measured by CH-chase in mouse striatal cells (STHdhQ7/Q111). Mean±SEM; n=3; (D) The change of mHTT degradation by treatment with autophagy inhibitor bafilomycin A (upper trace) compared to the DMSO-treated control (lower trace) in HD patient fibroblasts (Q68). Mean±SEM; n=2 (biological duplicates) for each sample at each time points because it is the usual setting for high-throughput screenings. Z′=1–3×(SD of DMSO+SD of BafA)/(average of BafA–average of DMSO). The signals at the final time point were utilized to calculate the Z′ value. (E) The change of mHTT degradation by treatment with the mTOR inhibitor rapamycin, which activates autophagy and accelerates mHTT degradation. Concentrations of 0.1 μmol/L and 1 μmol/L of rapamycin (0.1 μmol/L Rp and 1 μmol/L Rp) were tested compared to the DMSO-treated control in HD patient fibroblasts (Q68). Mean±SEM; n=4 (biological replicates) for each sample at each time points. Z′=1–3×(SD of DMSO+SD of 1 μmol/L Rp)/(average of DMSO–average of 1 μmol/L Rp). For (B), (D) and (E), *P<0.05, **P<0.01 by two-way ANOVA (difference between two groups of points) followed by Bonferroni post hoc tests (difference between the two points at each given time point). The signals from compounds treated samples are all compared with the DMSO-treated controls.

