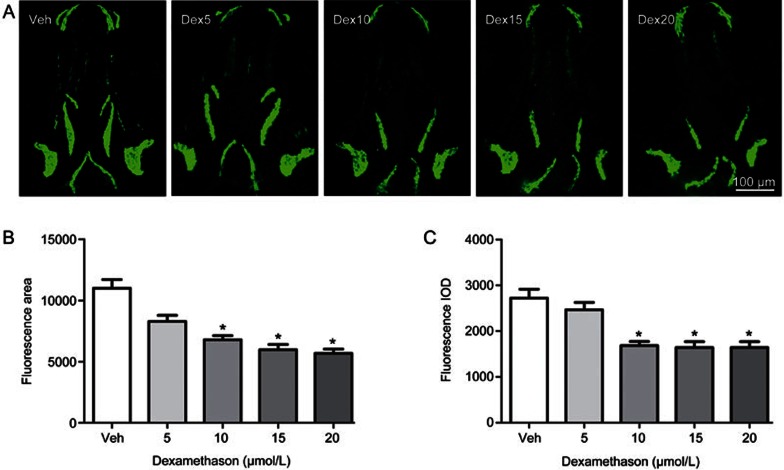
Figure 2.
Dex treatment leads to decreased osteoblast differentiation of skull in tg(sp7:egfp) larval zebrafish. (A) Green fluorescence images of skull dorsal aspect using LSCM in tg (sp7:egfp) larval zebrafish at 9 dpf exposed to 0, 5, 10, 15, and 20 μmol/L Dex for 6 d; (B) The influence of Dex on skull green fluorescence area analyzed by IPP6.0 in 9-dpf tg(sp7:egfp) larval zebrafish and (C) The influence of Dex on skull green fluorescence IOD analyzed by IPP6.0 in 9 dpf tg(sp7:egfp) larval zebrafish. Notes: LSCM (laser scanning confocal microscopy); IPP6.0 (Image-Pro Plus image analysis software version 6.0); IOD (integral optical density); Veh (vehicle control, 0.1% dimethyl sulphoxide); Dex5 (Dex 5 μmol/L); Dex10 (Dex 10 μmol/L); Dex15 (Dex 15 μmol/L); Dex20 (Dex 20 μmol/L). Data are given as mean±SD. n≥9. *P<0.05 vs vehicle control.

