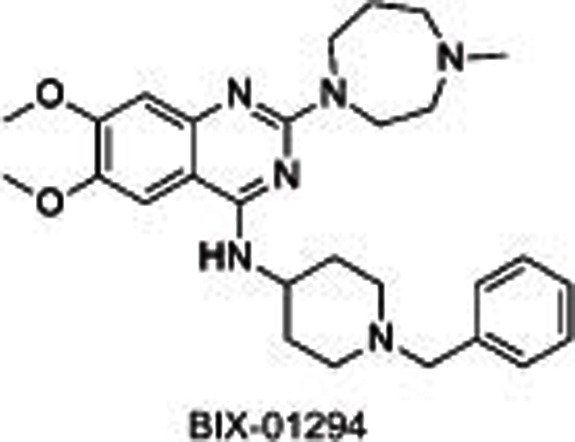
 |
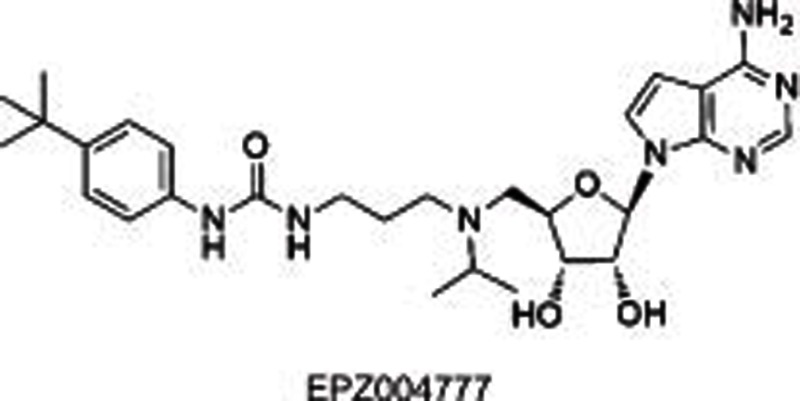
EHMTs |
Substrate competitive |
1.9±0.1 μmol/L (EHMT2)
0.7±0.1 μmol/L (EHMT1) |
500±43 nmol/L (MDA-MB-231) |
No |
No inhibition observed (other HMTs) |
Preclinical |
31,32,33
|
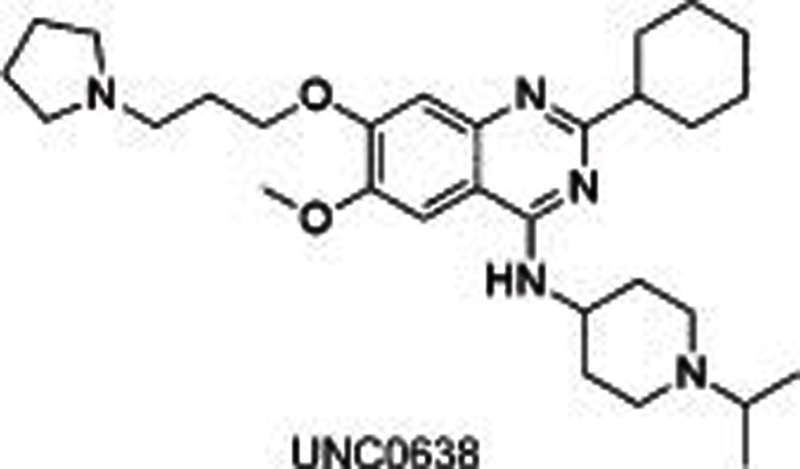 |
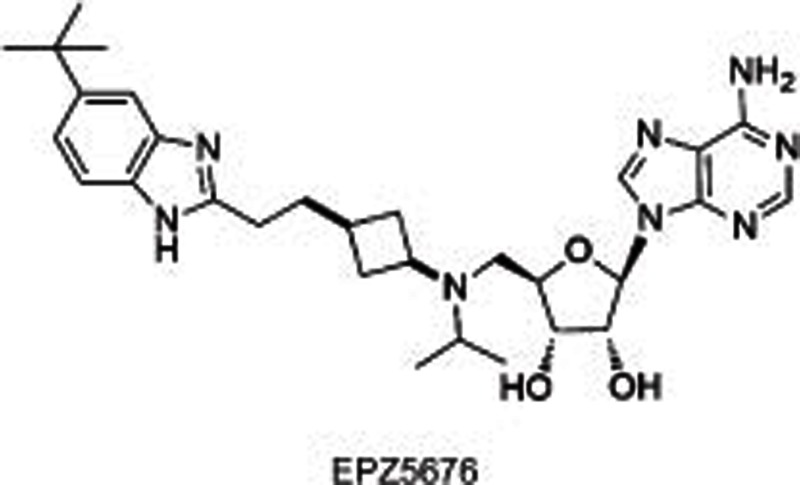
EHMTs |
Substrate competitive |
<15 nmol/L (EHMT2)
19±1 nmol/L (EHMT1) |
81±9 nmol/L (MDA-MB-231) |
No |
∼500 (other HMTs) |
Biological testing |
30,33
|
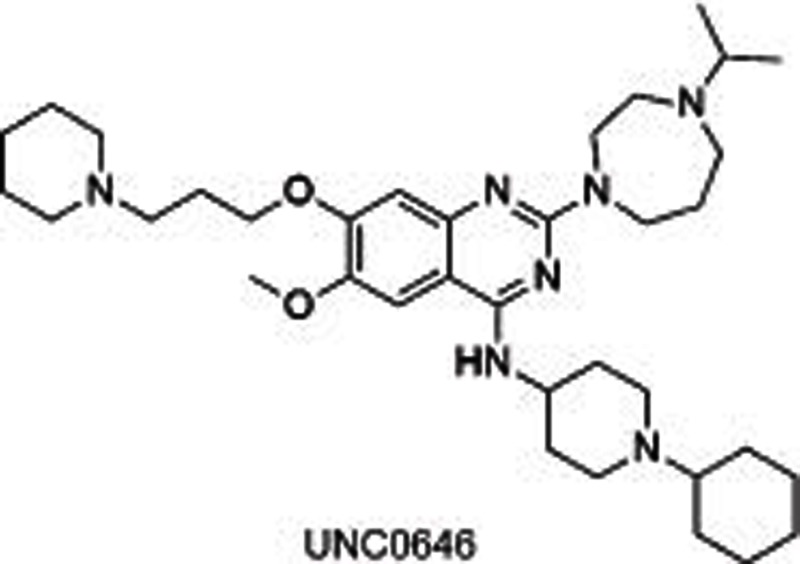 |
EHMTs |
Substrate competitive |
0.006 μmol/L (EHMT2) |
0.026 μmol/L (MDA-MB-231) |
No |
No report |
Biological testing |
34 |
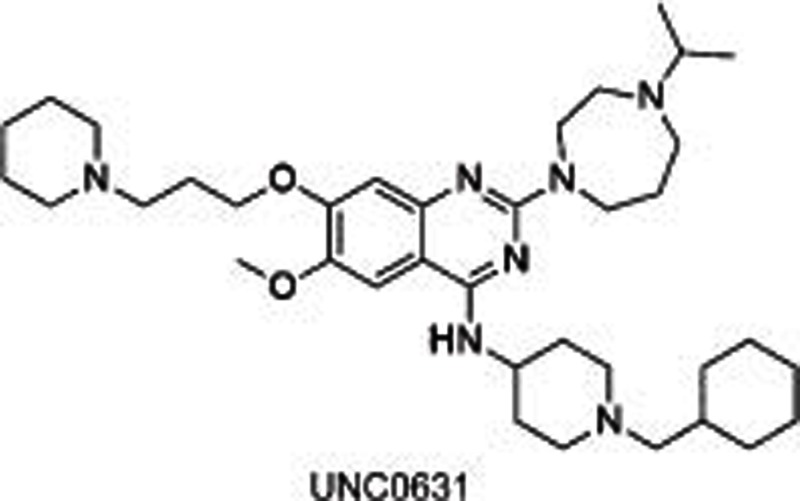 |
EHMTs |
Substrate competitive |
0.004 μmol/L (EHMT2) |
0.025 μmol/L (MDA-MB-231) |
No |
No report |
Biological testing |
34 |
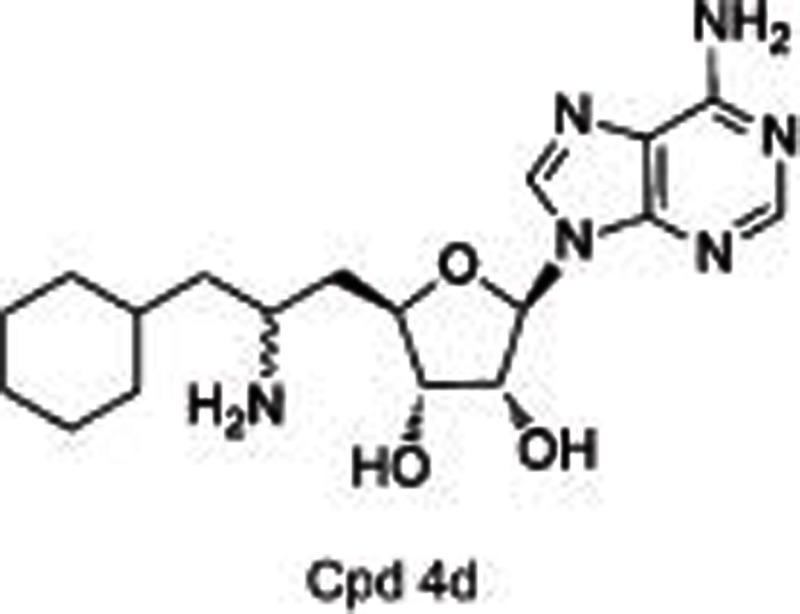 |
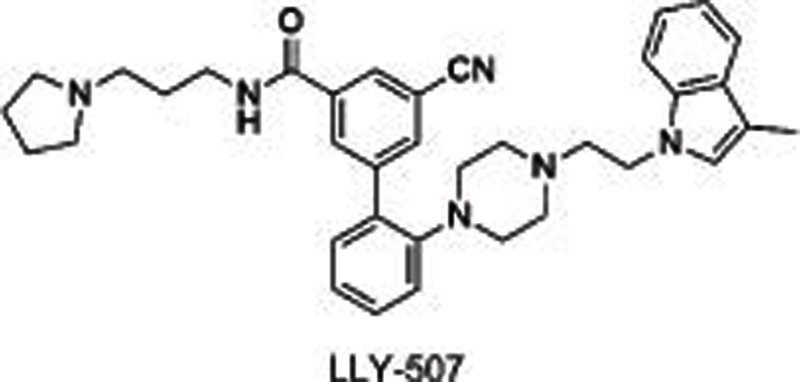
EHMTs |
Unknown |
1.6 μmol/L (EHMT2)
1.5 μmol/L (EHMT1) |
No |
No |
∼100 (other 3 HMTs) |
Biological testing |
35 |
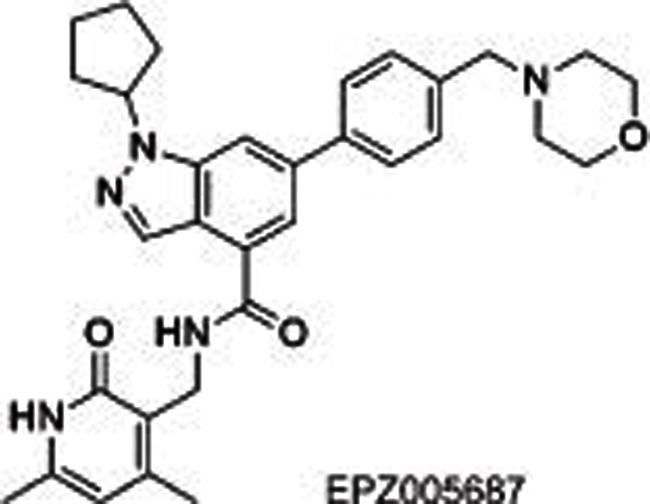 |
EZH2 |
SAM competitive |
54±5 nmol/L (EZH2-PRC2) |
80±30 nmol/L (OCI-LY19 EZH2WT) |
No |
∼50 (EZH1)
>500 (other 15 HMTs) |
Preclinical |
40 |
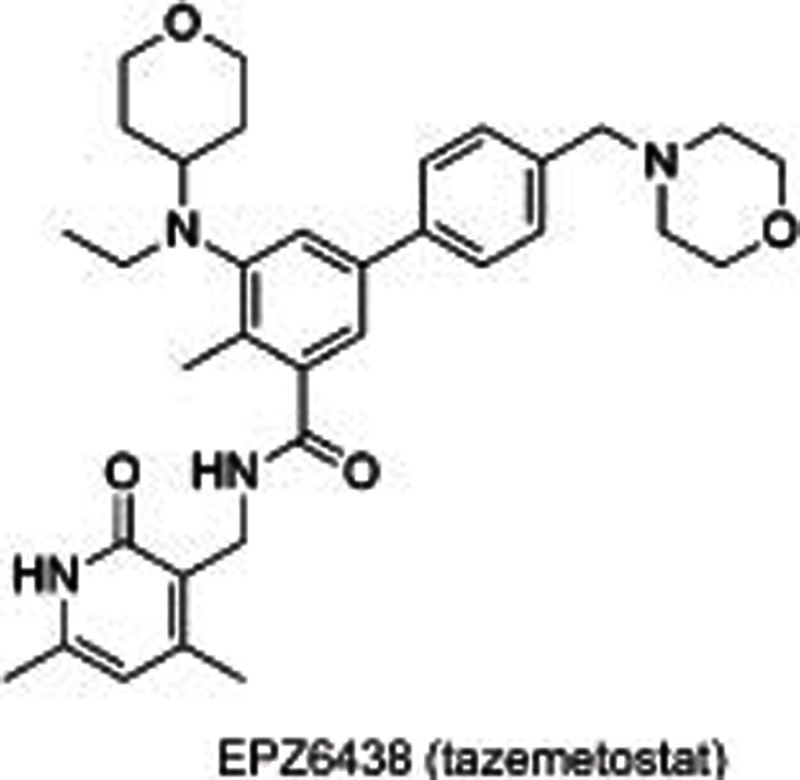 |
EZH2 |
SAM competitive |
11±5 nmol/L (EZH2) 2–38 nmol/L (EZH2 mutants) |
8 nmol/L (OCI-LY19, EZH2WT), 2–90 nmol/L (EZH2 mutants) |
Yes |
∼35 (EZH1)
>4500 (other HMTs) |
Phase II |
51 |
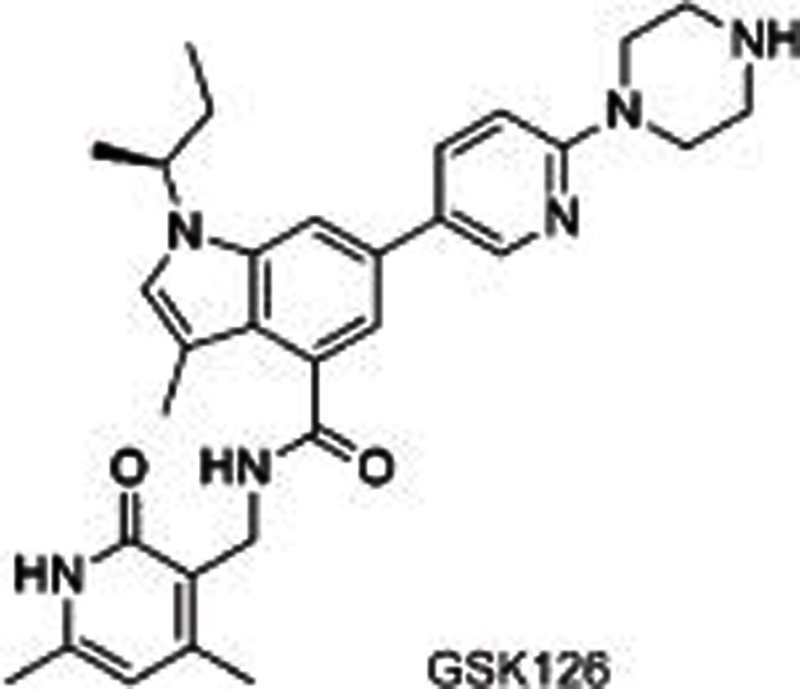 |
EZH2 |
SAM competitive |
9.9 nmol/L (EZH2) |
28–861 nmol/L (DLBCL, EZH2 mutants) |
Yes |
∼150 (EZH1)
∼1000 (other 20 HMTs) |
Phase I |
49 |
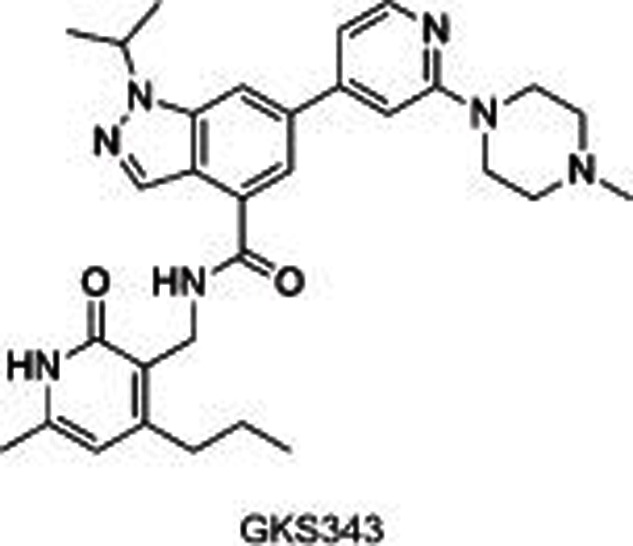 |
EZH2 |
SAM competitive |
4 nmol/L (EZH2) |
174±84 nmol/L (HCC1806) |
No |
∼60 (EZH1)
∼1000 (other HMTs) |
Preclinical |
48 |
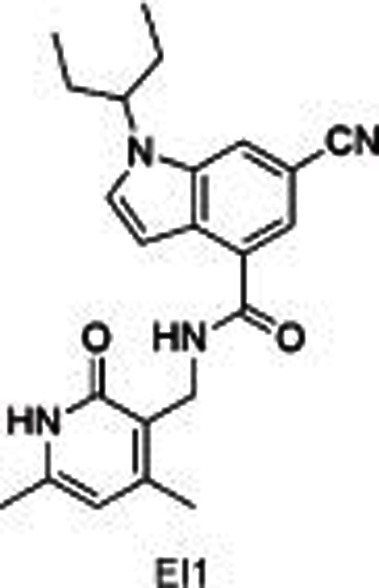 |
EZH2 |
SAM competitive |
15±2 nmol/L (EZH2WT)
13±3 nmol/L (EZH2Y641F) |
∼370 nmol/L (SU-DHL6, EZH2Y641N) |
No |
∼90 (EZH1) >10 000 (other HMTs) |
Biological testing |
50 |
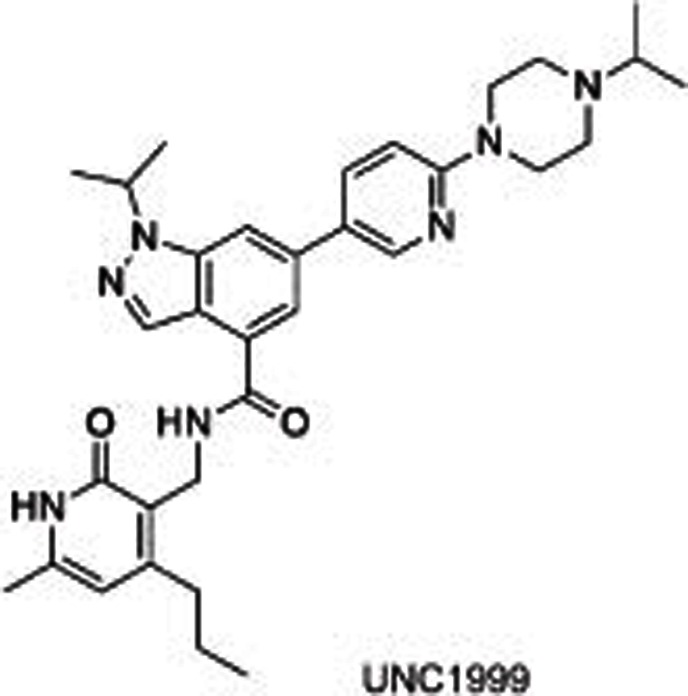 |
EZH2 |
SAM competitive |
<10 nmol/L (EZH2) |
124±11 nmol/L (MCF10A, EZH2WT) |
Yes |
∼10 (EZH1) ∼10000 (other HMTs) |
Preclinical |
47 |
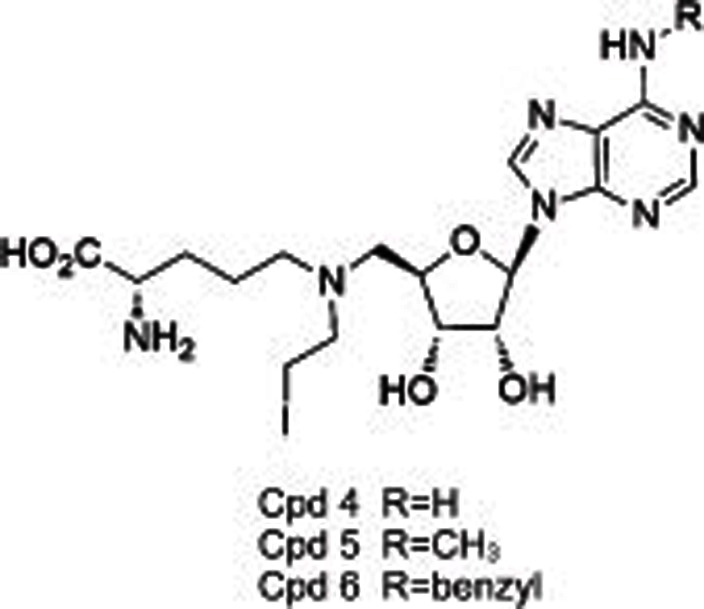 |
DOT1L |
SAM competitive |
38 nmol/L (Cpd 4)
120 nmol/L (Cpd 5)
110 nmol/L (Cpd 6) |
No |
No |
>29 (other 4 HMTs) |
Biological testing |
21 |
 |
DOT1L |
SAM competitive |
0.4±0.1 nmol/L |
0.17–6.47 μmol/L (MLL-rearranged leukemia cell lines) |
Yes |
>1000 (other HMTs) |
Preclinical |
22 |
 |
DOT1L |
SAM competitive |
Ki=0.08±0.03 nmol/L |
3.5±0.7 nmol/L (MV4-11) |
Yes |
>37 000 (other 15 HMTs) |
Phase I |
23 |
 |
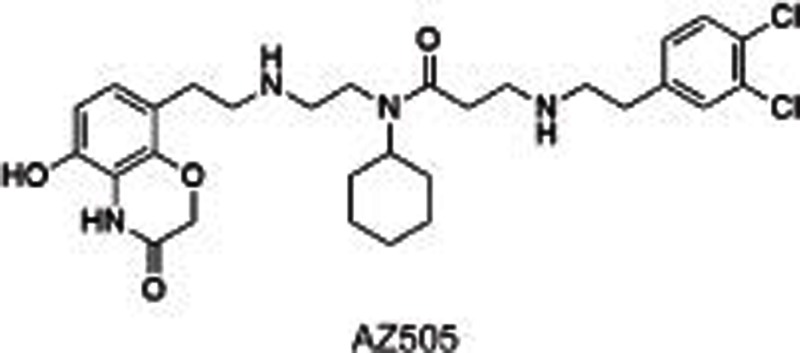
SMYD2 |
Substrate competitive |
<15 nmol/L (p53)
31 nmol/L (H4) |
0.6 μmol/L (U2OS)
0.6 μmol/L (KYSE-150) |
No |
>100 (other 25 HMTs and non-HMTs) |
Biological testing |
56 |
 |
SMYD2 |
Substrate competitive |
0.12 μmol/L |
No |
No |
>700 (6 other HMTs) |
Biological testing |
59 |
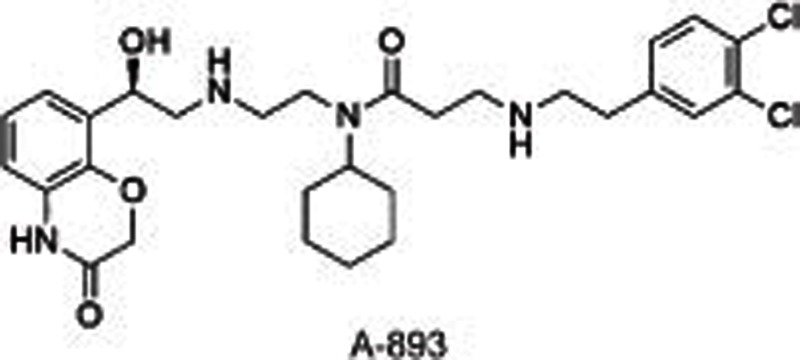 |
SMYD2 |
Substrate competitive |
2.8 nmol/L |
42% reduction of p53K370me1 (A549) |
No |
No significant inhibition (>50%) at 1 μmol/L for other 30 HMTs |
Biological testing |
60 |


