Figure 2.
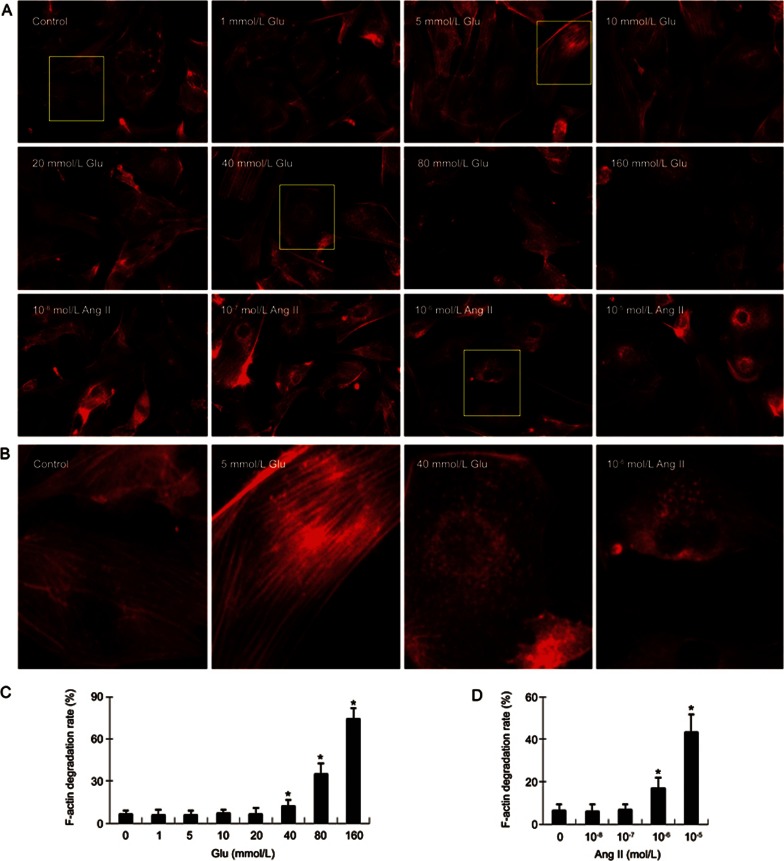
Degradation of F-actin following exposure of cardiac fibroblasts to different concentrations of glucose (Glu) and angiotensin II (Ang II). (A) Rhodamine phalloidin staining shows F-actin morphology and degradation in cardiac fibroblasts following exposure to 1–160 mmol/L glucose and 10−8–10−5 mol/L angiotensin II for 24 h (400×). Glucose (≥40 mmol/L) and angiotensin (≥10−6 mol/L) each induced degradation of F-actin in cardiac fibroblasts; however, glucose (≤20 mmol/L) and angiotensin II (≤10−7 mol/L) did not significantly affect F-actin degradation. The degradation of F-actin was defined as the cells with less actin filaments. (B) Amplified single cell images show that high concentrations of glucose (40 mmol/L) and angiotensin II (10−6 mol/L) cause F-actin degradation. The assembly F-actin filaments are clearly shown in control fibroblasts and fibroblasts treated with 5 mmol/L glucose, but much less in the cells treated with 40 mmol/L glucose and 10−6 mol/L angiotensin II. (C) The bar graph shows the quantification of F-actin degradation rates (the cells with degraded F-actin vs total cells) following exposure of fibroblasts to different concentrations of glucose. (D) The bar graph shows the quantification of F-actin degradation rate following exposure of fibroblasts to different concentrations of angiotensin II. Each figure represents cells in 20 randomly selected microscopic fields (five fields/sample). Mean±SD. Bar graphs represent summary of 5 independent experiments. *P<0.05 vs control.

