
Fig. 3.
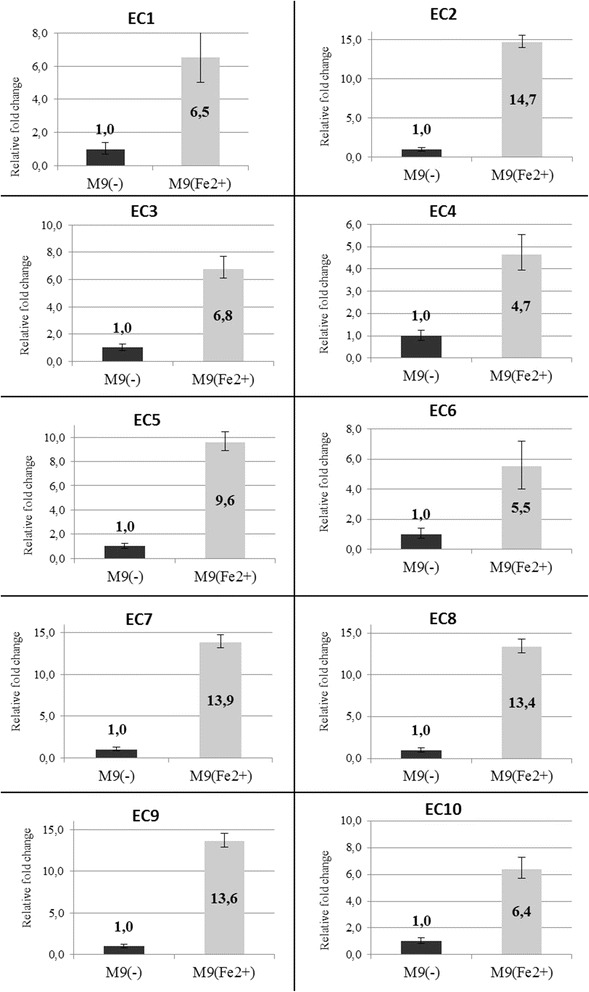
Relative expression of katG gene in the 10 investigated E. coli strains (EC1-EC10). Fold change in gene expression is presented for E. coli strains cultured in M9(Fe2+) media (grey bars) compared to strains incubated in M9(-) media (black bars). Expression was measured during logarithmic phase of bacterial growth by quantitative real-time PCR