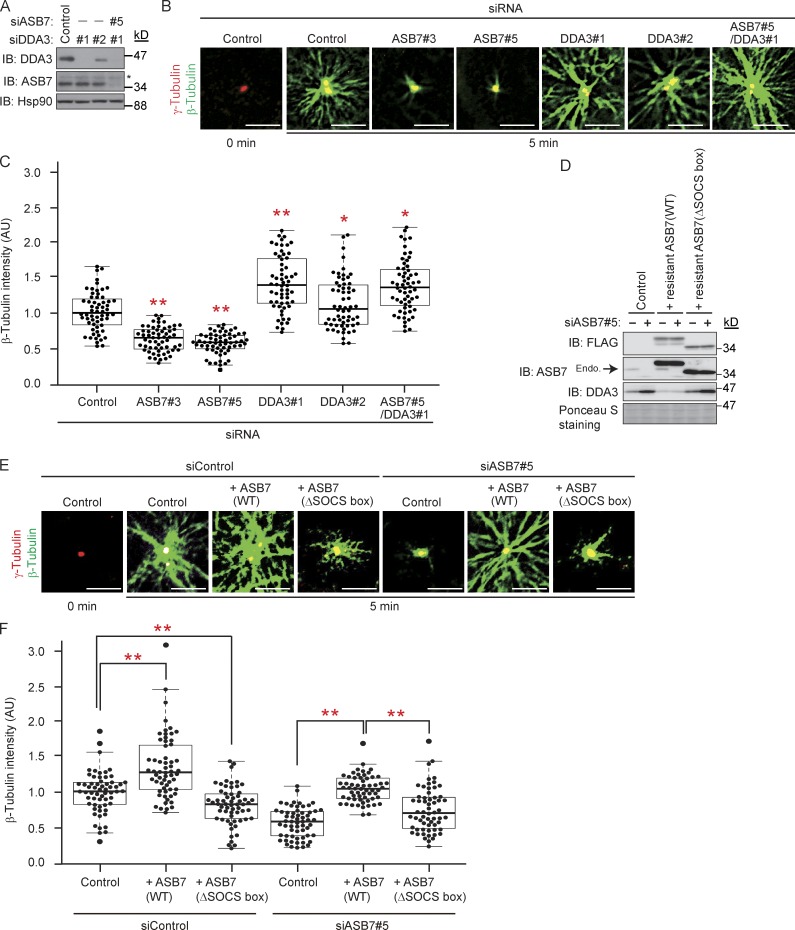
Figure 5.
Regulation of MT polymerization by ASB7 and DDA3. (A) Knockdown of ASB7 and/or DDA3. Two independent siRNAs (#1 and #2) targeting DDA3 or siRNA targeting ASB7 were transfected into HeLa cells. The lysates were subjected to Western blotting with antibodies against DDA3, ASB7, or Hsp90. Hsp90 is shown as a loading control. Asterisk denotes a nonspecific band. (B) MT regrowth assay using ASB7 and/or DDA3 knockdown HeLa cells. After incubation for 5 min to allow MT regrowth, cells were fixed and immunostained with anti–β-tubulin or anti–γ-tubulin. (C) Box plots of β-tubulin intensities after MT regrowth. About 20 cells from five randomly selected loci were examined in each experiment. The experiment was repeated three times independently, and a total of 60 cells were examined. The mean of normalized fluorescence intensity, expressed in arbitrary units (AU) of fluorescence, was calculated. The box plot shows the normalized expression values: bottom line outside the box, 10th percentile; bottom border of the box, 25th percentile; middle line within the box, median; upper border of the box, 75th percentile; top line outside the box, 90th percentile. Each dot indicates the intensity of an individual cell. (D) Complementation of ASB7 in ASB7 knockdown cells prevents DDA3 accumulation. siRNA targeting ASB7 or control was transfected into HeLa cells with stably expressing siRNA-resistant ASB7-3×FLAG (WT or ΔSOCS box). The lysates were subjected to Western blotting with antibodies against FLAG, ASB7, or DDA3. Ponceau S staining is shown as a loading control. Endogenous ASB7 is indicated by an arrow. (E) MT regrowth assay using ASB7 knockdown or ASB7-complemented HeLa cells performed as in B. Bars, 5 µm. (F) Box plots of β-tubulin intensities after MT regrowth calculated as in C. For all graphs, *, P < 0.05; **, P < 0.01.

