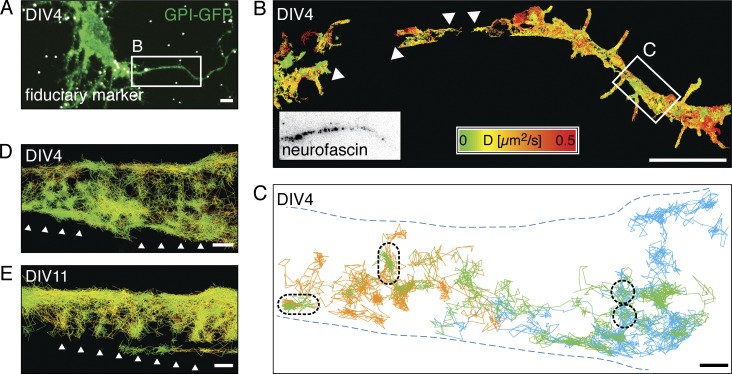
Figure 2.
High-speed SPT shows that diffusing GPI-GFP molecules revisit small areas in the AIS. (A) Merged fluorescence micrograph of a DIV4 hippocampal neuron expressing GPI-GFP (green) after PFA fixation with fiduciary markers (white) for drift correction and image correlation. (B) Plot of SPT trajectories of anti-GFP nanobody-coupled quantum dots (n = 3,375) on GPI-GFP. Trajectories are color-coded according to the instantaneous diffusion coefficient. The AIS was identified by live immunolabeling of neurofascin (box). Not all areas were covered homogeneously by trajectories (arrowheads). (C) Plot of selected long trajectories (>500 steps, orange, green, and blue) along a segment with reduced lateral mobility (white box in B). The trajectories cover the axon inhomogeneously and show local zones, which are revisited by individual QDs (black dashed lines). (D) Same plot of area as in C, with all trajectories >20 steps plotted (n = 231) and color-coded according to the instantaneous diffusion coefficient as in B. Arrowheads emphasize a pattern emerging from the distribution of the trajectories. (E) Plot of trajectories of anti-GFP nanobody-coupled QDs on the AIS of a DIV11 neuron expressing GPI-GFP (n = 501). Trajectories are color coded as in B. Arrowheads emphasize an emergent pattern similar to that in D. Bars: (A and B) 5 µm; (C–E) 200 nm.

