
Figure 4.
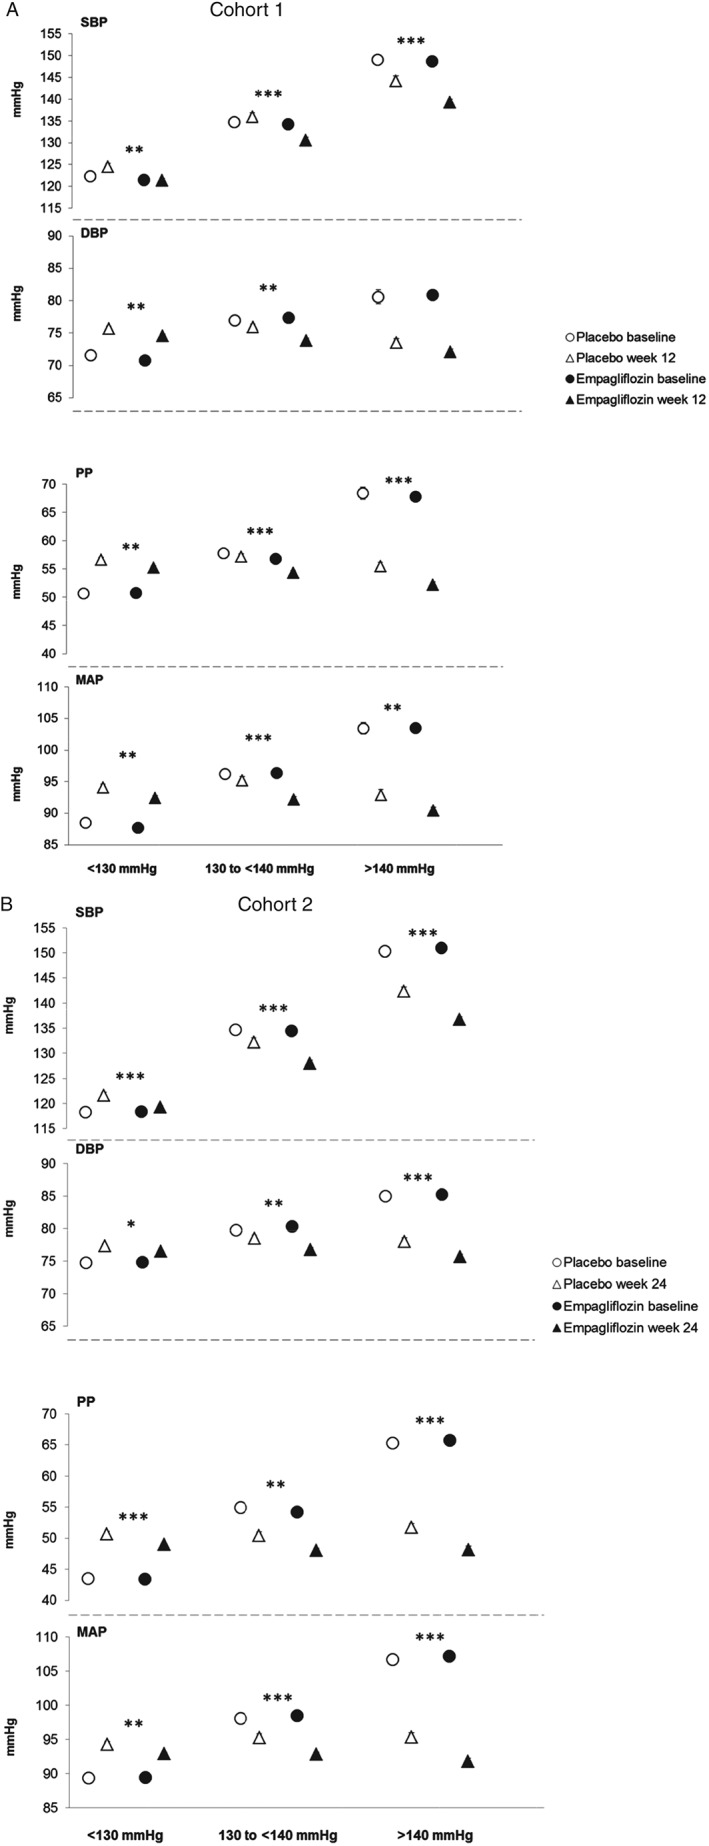
Systolic blood pressure (SBP), diastolic blood pressure (DBP), pulse pressure (PP) and mean arterial pressure (MAP) by subgroups of baseline SBP. (A) SBP, DBP, PP and MAP at baseline and at week 12 in cohort 1. (B) SBP, DBP, PP and MAP at baseline and at week 24 in cohort 2. Baseline data are mean ± standard error (s.e.), week 12 or 24 data are adjusted mean ± s.e. based on analysis of covariance (ancova) in the full analysis set using last observation carried forward (LOCF) imputation. In cohort 1, measurements were based on mean 24‐h ambulatory blood pressure monitoring (ABPM) and in cohort 2, they were based on seated office measurements. ***p < 0.001, **p < 0.01 and *p < 0.05 for adjusted mean differences for empagliflozin versus placebo in change from baseline based on ancova with LOCF imputation.