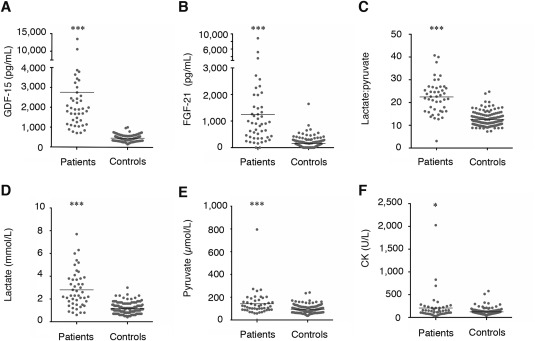
Figure 2.

All biomarker concentrations for MDs and controls, and demography between MDs and non‐MDs patients. (A) GDF‐15, (B) FGF‐21, (C) lactate:pyruvate ratio, (D) lactate, (E) pyruvate, and (F) CK. MD patients exhibited significantly higher levels of all biomarkers compared to controls. CK = creatine kinase; FGF‐21 = fibroblast growth factor 21; GDF‐15 = growth differentiation factor 15; MD = mitochondrial disorder.
