
Figure 3.
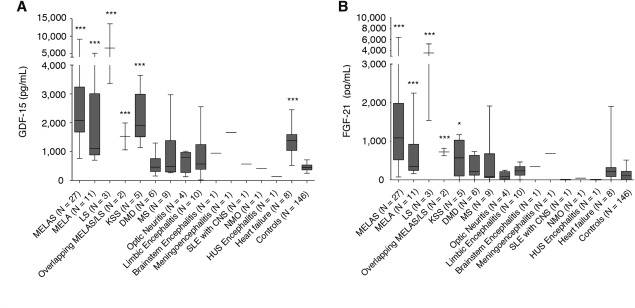
Comparison of biomarkers for MDs, and GDF‐15 and FGF‐21 concentrations for MDs and non‐MDs. GDF‐15 and FGF‐21 concentrations in the patients who suffered from MD subtypes, DMD, MS, optic neuritis, limbic encephalitis, brainstem encephalitis, menigoencephalitis, SLE with CNS, NMO, and HUS encephalitis, and HF, and the control group are shown. Each MD subtype displayed significantly higher levels of GDF‐15 and FGF‐21 than the control group. HF displayed significantly higher levels of only GDF‐15 than the control group. (A) GDF‐15 and (B) FGF‐21. CNS = central nervous system; DMD = Duchenne muscular dystrophy; FGF‐21 = fibroblast growth factor 21; GDF‐15 = growth differentiation factor 15; HUS = hemolytic uremic syndrome; KSS = Kearns‐Sayre syndrome; LS = Leigh syndrome; MD = mitochondrial disorder; MS = multiple sclerosis; MELA = mitochondrial encephalopathy, lactic acidosis (mitochondrial myopathy); MELAS = mitochondrial encephalopathy, lactic acidosis, and stroke‐like episodes; NMO = neuromyelitis optica; SLE = systemic lupus erythematosus.