
Figure 7.
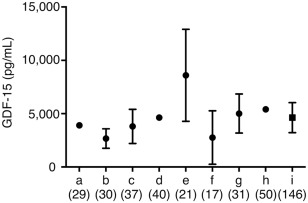
GDF‐15 concentrations in the healthy controls reported from literatures. GDF‐15 concentrations were recruited from literatures measured by the same ELISA kit (R&D Systems, Minneapolis, MN), that are a13, b14, c8, d15, e16, f17, g18, h19, and i (our data). Data are shown in mean ± standard deviation (SD). References of a13, d15, and h19 are not described in SD. The number in parenthesis shows sample number. Our GDF‐15 level in the healthy controls was similar to previous literatures.8, 13, 14, 15, 16, 17, 18, 19 GDF‐15 = growth differentiation factor 15.