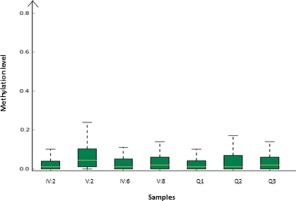
Figure 3.

CpG‐methylation level boxplot showing the overall methylation levels of each sample compared side by side. The methylation level on the Y‐axis is the fraction of methylated reads/total number of reads. Sample IV:2, V:2, IV:6, and V:8 are from affected members and Q1, Q2, Q3 are blood controls. The overall degree of methylation detected is low and there is no significant difference between the patients and the control. [Color figure can be viewed in the online issue, which is available at wileyonlinelibrary.com.]
