
Figure 4.
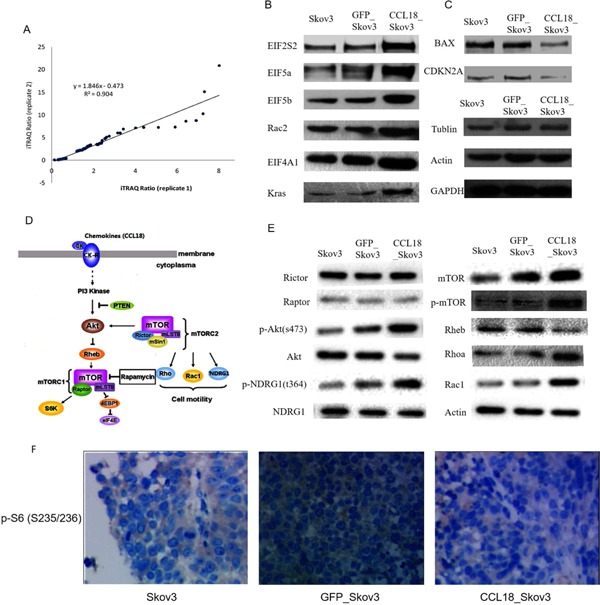
Proteomics analysis of xenograftion with CCL18_Skov3 and Skov3 cell lines using iTRAQ approach. (A) Plotting the iTRAQ ratios of the final 136 altered proteins from both biological replicates identified the correlation coefficient (R 2) at 0.904, which interpreted acceptable variation of iTRAQ ratios of the significantly regulated proteins in both biological replicates. (B) Western blot studies to validate differential expression pattern of 8 candidate proteins. Up‐regulation of EIF2S2, EIF5a, EIF5b, EIF4A1, Rac2, Kras. (C) Down‐regulation of BAX and CDKN2A in xenografts were observed by Western blot studies. (D) The schema of CCL18‐stimulated mTOR signaling. (E) Western blot analysis of mTOR signaling on mTOR biomarkers. (F) Immunohistochemical images of p‐S6 (S235/236) staining in tumor xenografts, 200×.