
Figure 1.
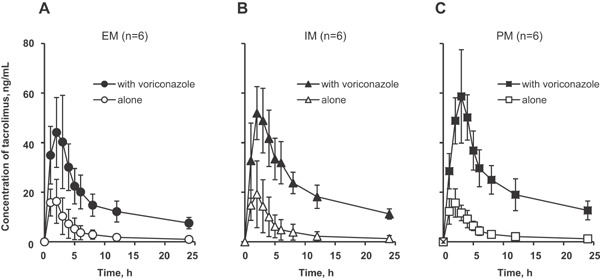
Mean (± SD) tacrolimus whole‐blood concentration‐time profiles after a single oral administration of 3 mg of tacrolimus alone or in combination with 200 mg of voriconazole twice daily at steady state to CYP2C19 EM (A), IM (B), and PM (C) subjects. EM, extensive metabolizer; IM, intermediate metabolizer; PM, poor metabolizer.