Figure 1.
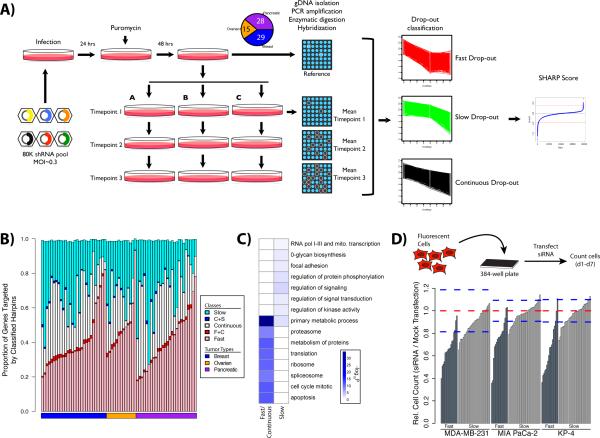
Outline of Procedure for Timecourse shRNA Screening. (A) Schematic representing the steps that are involved in the shRNA functional screening. (B) Hairpins were classified based on heuristic rules (see Supplemental Table 3). The proportion of genes falling into each category is shown as a stacked bar chart. The pink, white and cyan bar segments detail genes that are targeted by a single hairpin class, while the red and blue segments indicate the sparse overlap between classes. Stacked bars do not reach a value of 1.0 as the minimal overlap observed between fast and slow, as well as all three classes is omitted. The full classification results are shown in Supplemental Table 3. (C) Enrichment plot of GO ‘Biological Process’ terms and MSigDB pathways within classified hairpins. Darker blue colours indicate more significant p-values corresponding to the enrichment. The full set of enriched terms is shown in Supplemental Figure 1. (D) Validation of selected shRNA hits by siRNA. Growth inhibition due to target gene knock-down was determined relative to mock transfected controls in MDA-MB-231, MIA PaCa-2, and KP4 cell lines. Red dashed lines indicate the mean of 60 replicate mock transfections, while the blue dashed lines indicate mean ± 3 standard deviations.

