Fig. 2.

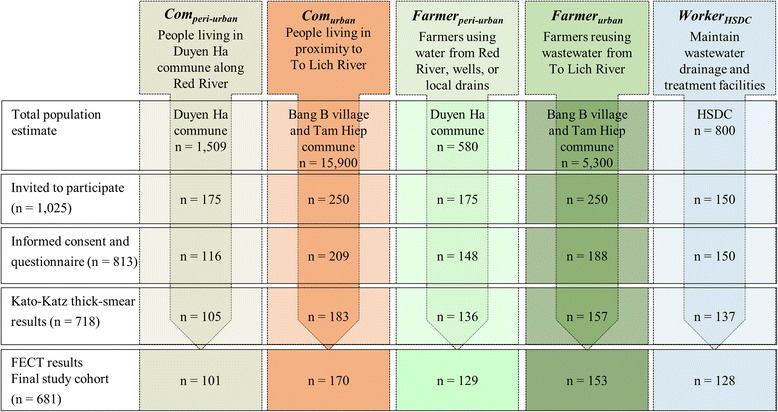
Flow chart indicating the enrolment of study participants and compliance, stratified into exposure groups in the cross-sectional survey in the Than Tri district, Hanoi, between April and June 2014

Flow chart indicating the enrolment of study participants and compliance, stratified into exposure groups in the cross-sectional survey in the Than Tri district, Hanoi, between April and June 2014