Fig. 2.

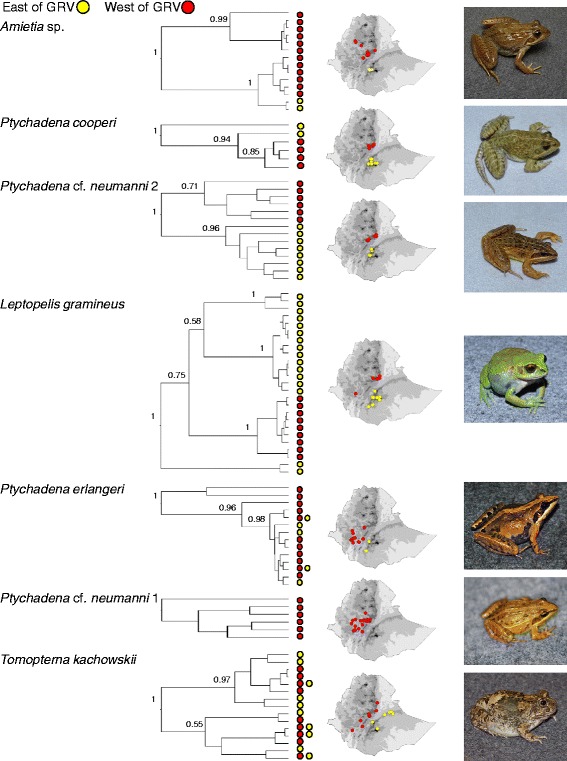
Mitochondrial phylogeny of Ethiopian anurans constructed using BEAST, maps of Ethiopia showing collecting localities and pictures of the organisms. The numbers at the nodes correspond to posterior probability values. Trees are not to scale

Mitochondrial phylogeny of Ethiopian anurans constructed using BEAST, maps of Ethiopia showing collecting localities and pictures of the organisms. The numbers at the nodes correspond to posterior probability values. Trees are not to scale