Fig. 4.

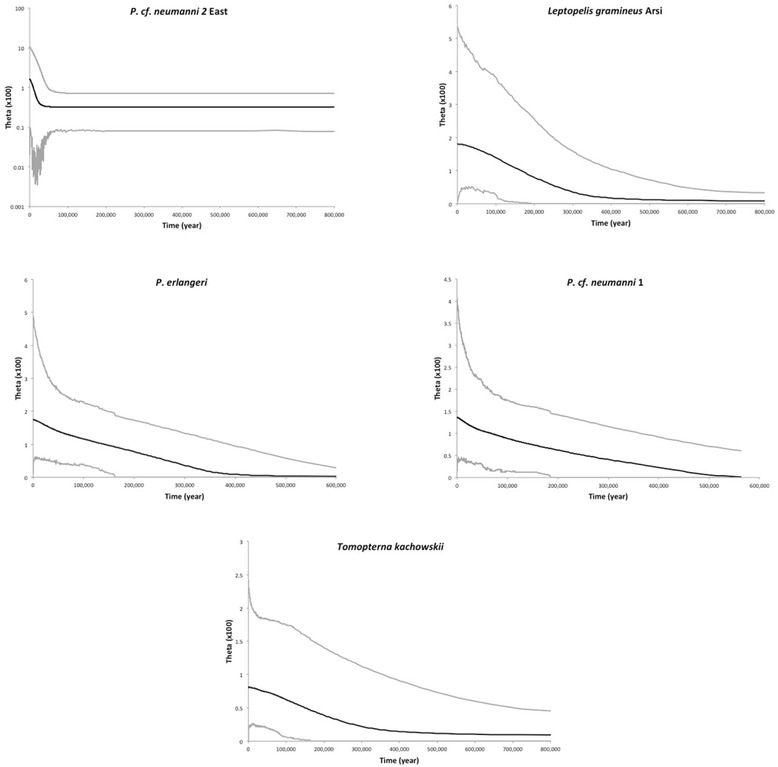
Demographic trajectories estimated by Extended Bayesian Skyline Plot (EBSP). The median population size is shown with a black line and the 95 % credible intervals are shown with grey lines

Demographic trajectories estimated by Extended Bayesian Skyline Plot (EBSP). The median population size is shown with a black line and the 95 % credible intervals are shown with grey lines