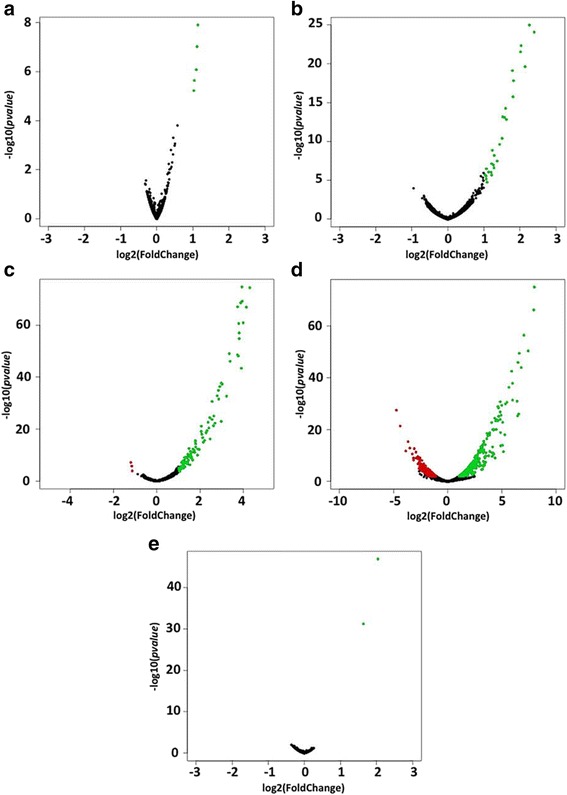
Fig. 1.

Volcano plots of differentially expressed (DE) genes under five stress conditions. On the x-axis the changes in expression for all genes under stress condition compared to the unstressed condition for a paraquat, b H2O2, c MMC, d DETA/NO, and e MNNG with the p-values on the y-axis. Genes with a fold change greater than 2 and a p-value ≤ 0.05 were considered as DE. Genes that do not fulfil these criteria are shown in black. Green dots correspond to up-regulated genes while red dots correspond to down-regulated genes under stress
