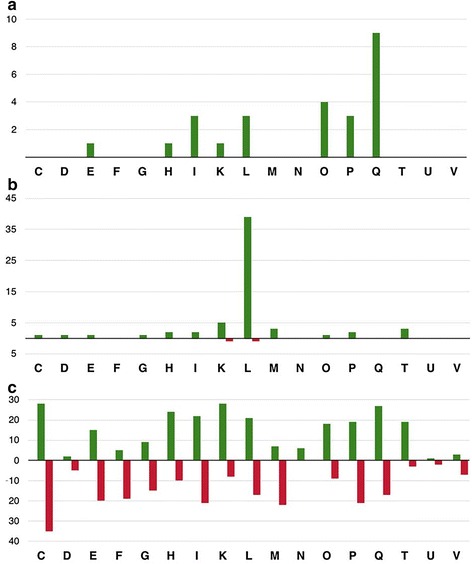
Fig. 2.

Classification of the differentially expressed (DE) genes according to COG categories. Histograms indicate the number of genes in each COG category. Green colour corresponds to up-regulated genes while red colour corresponds to down-regulated genes. This classification is shown only for (a) H2O2, (b) MMC and (c) DETA/NO treatment as Paraquat treatment gave only five DE genes (Additional file 1). COG categories: [C] Energy production and conversion, [D] Cell cycle control, cell division, chromosome partitioning, [E] Amino acid transport and metabolism, [F] Nucleotide transport and metabolism, [G] Carbohydrate transport and metabolism, [H] Coenzyme transport and metabolism, [I] Lipid transport and metabolism, [K] Transcription, [L] Replication, recombination and repair, [M] Cell wall/membrane/envelope biogenesis, [N] Cell motility, [O] Post-translational modification, protein turnover, and chaperones, [Q] Secondary metabolites biosynthesis, transport, and catabolism, [T] Signal transduction mechanisms, [U] Intracellular trafficking, secretion, and vesicular transport, [V] Defense mechanisms
