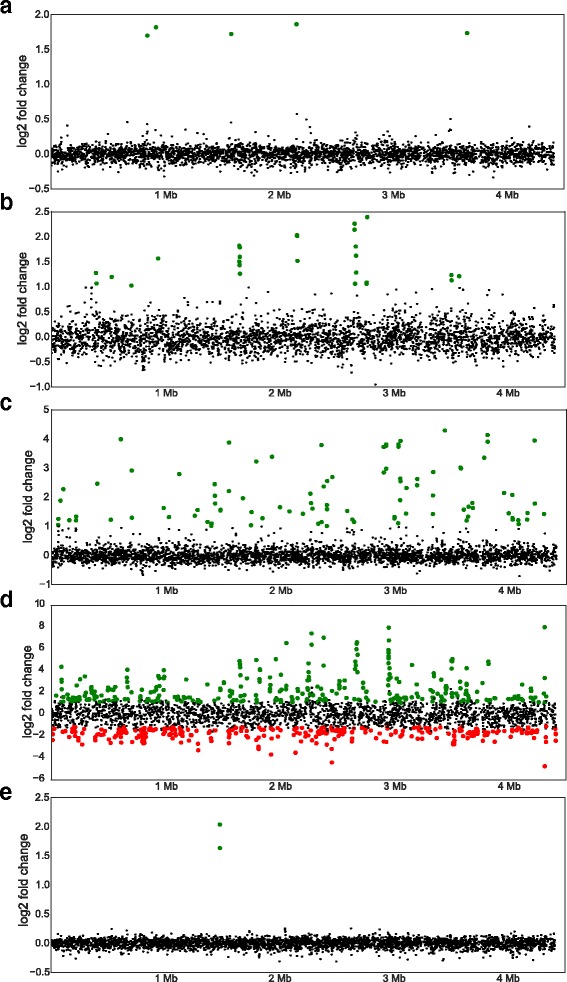
Fig. 4.

Mapping of the fold change of each gene according to its genomic location. Each dot corresponds to one gene. The x-axis corresponds to the genomic coordinates and the y-axis to the log2 fold change. Significantly up-regulated genes are indicated with green dots while significantly down-regulated genes are indicated by red dots. a Paraquat, b H2O2, c MMC, d DETA/NO, and e MNNG
