
Fig. 1.
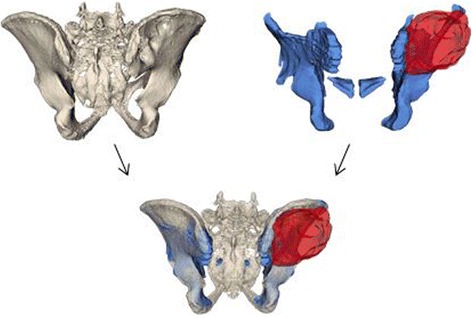
Superimposition of CT (upper left; beige) and MRI (upper right; blue) images to generate a 3-D model (bottom) of the tumor (red) and its surrounding structures
Official websites use .gov
A
.gov website belongs to an official
government organization in the United States.
Secure .gov websites use HTTPS
A lock (
) or https:// means you've safely
connected to the .gov website. Share sensitive
information only on official, secure websites.
Superimposition of CT (upper left; beige) and MRI (upper right; blue) images to generate a 3-D model (bottom) of the tumor (red) and its surrounding structures