Fig. 2.

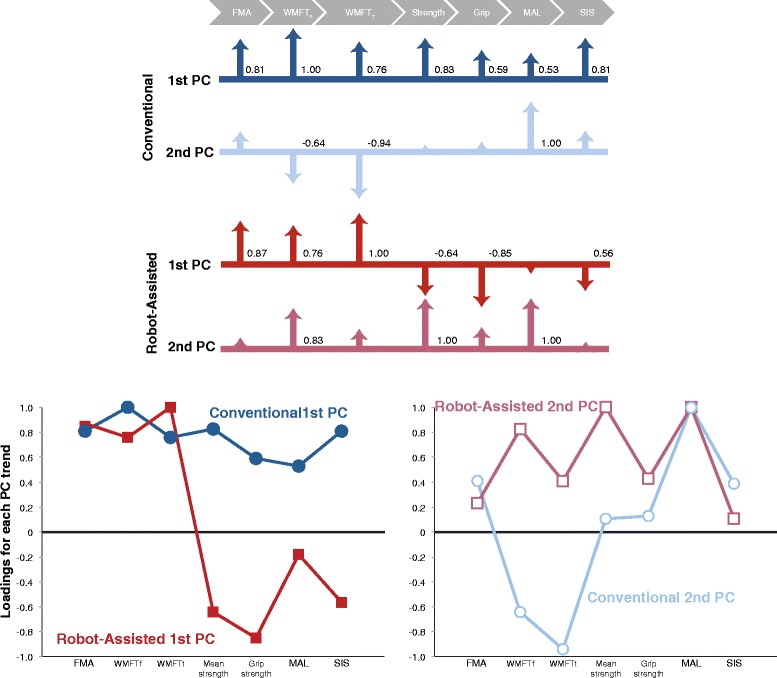
Graphical representation of the two most prominent rehabilitative trends for each therapy. The loadings of each trend quantify the correlations among changes in outcomes. Top: Shown as scaled arrows. Bottom: Shown as line plots

Graphical representation of the two most prominent rehabilitative trends for each therapy. The loadings of each trend quantify the correlations among changes in outcomes. Top: Shown as scaled arrows. Bottom: Shown as line plots