Fig. 2.

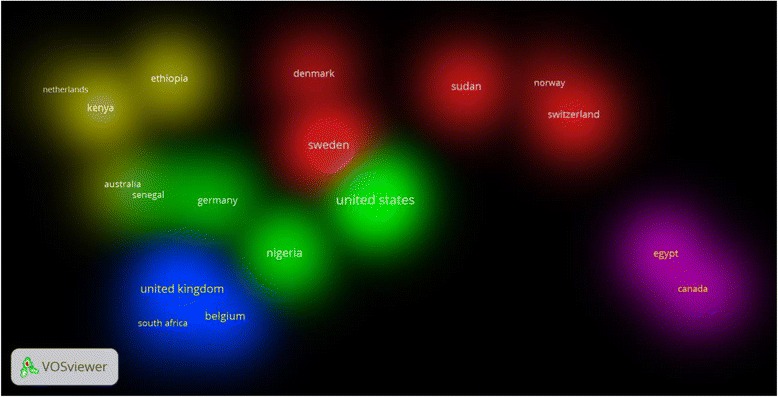
Density visualization of clusters of country co-authorships using VOSviewer for publications on FGM/C (1930 – 2015). Using a minimum threshold of 5 documents per country. The map included 21 countries

Density visualization of clusters of country co-authorships using VOSviewer for publications on FGM/C (1930 – 2015). Using a minimum threshold of 5 documents per country. The map included 21 countries