
Fig. 5.
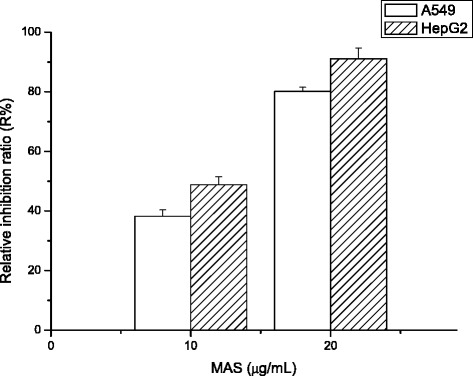
Cell viability effects of MAS at different concentration in A549 and HepG2 cells using the MTT assay (Mean ± SD, n = 3)
Official websites use .gov
A
.gov website belongs to an official
government organization in the United States.
Secure .gov websites use HTTPS
A lock (
) or https:// means you've safely
connected to the .gov website. Share sensitive
information only on official, secure websites.
Cell viability effects of MAS at different concentration in A549 and HepG2 cells using the MTT assay (Mean ± SD, n = 3)