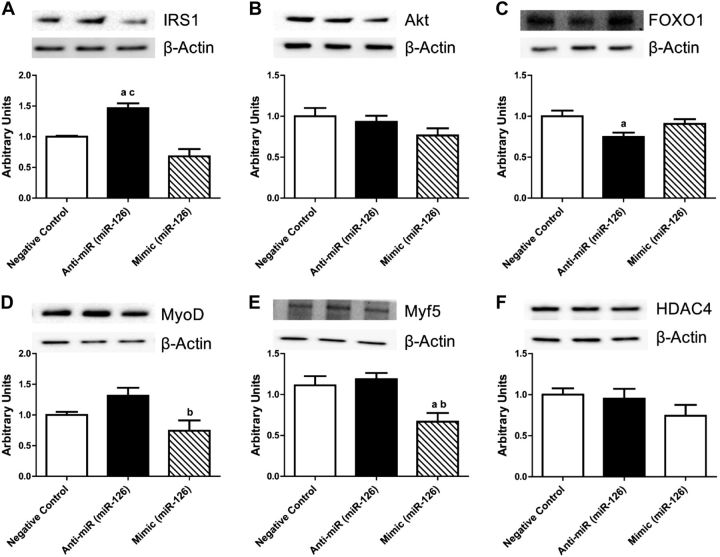
Figure 6.
Protein expression of myogenic regulators in skeletal muscle cells after miR-126 inhibition and overexpression. Total protein content of IRS1 (A), protein kinase B (Akt; B), FOXO1 (C), MyoD (D), Myf5 (E), and HDAC4 (F) in negative control (CON), miR-126 inhibition (anti-miR), and miR-126 overexpression (mimic). Relative protein levels were quantified using Western blot analysis. aP < 0.05 vs. CON, bP < 0.05 vs. anti-miR, cP < 0.05 vs. mimic; n = 3/group.

