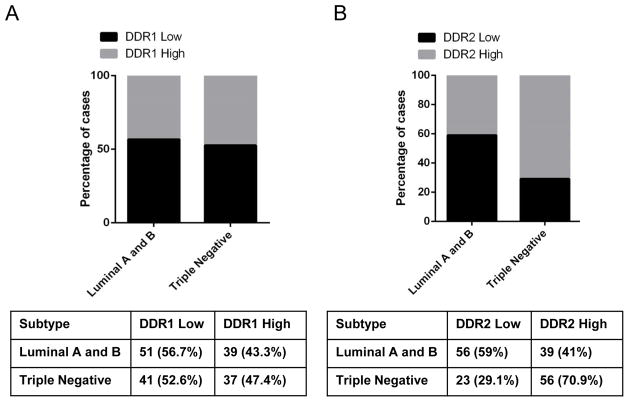
FIGURE 3. Relationship between DDR1 and DDR2 expression with breast cancer subtype.
A. Graph shows equal distribution of high and low DDR1 expressing tumors within the luminal and TNBC subtypes. B. DDR2 expression is significantly higher in TNBC compared to Luminal tumors (Chi Square test p<0.0001).

