
Figure 1. Genetic and physiological differences between seven strains of E. coli.
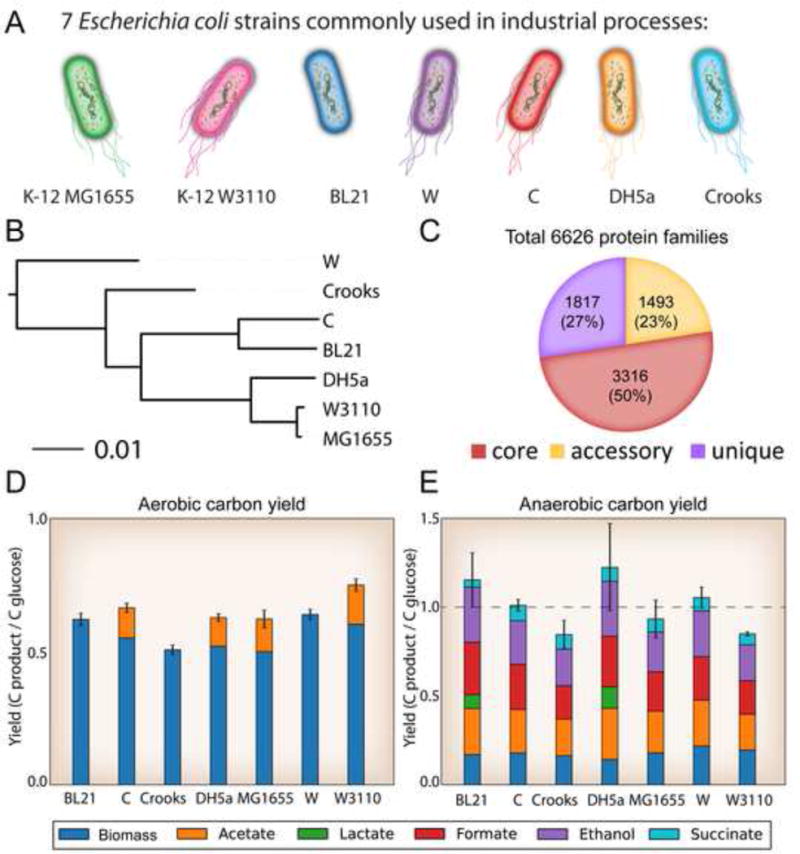
A) The seven industrial relevant E. coli strains selected for this study. This panel establishes the colour scheme that will be used to represent strain-specific data on these strains throughout the rest of the manuscript, as well as the motility characteristics of each strain. B) A phylogenetic tree based on full-genome DNA alignment of the seven strains. C) Total protein families in the strains examined. Core genes (red) are those that were present in all 7 strains, genes present in 2–6 strains are labelled accessory (yellow), and unique genes are only present in a single strain (purple). D & E) Physiological behaviour and comparison of the different strain’s carbon yield in aerobic and anaerobic growth conditions. Yields are calculated in terms of glucose uptake rates. Carbon dioxide was not measured. Overall, the by-product profiles differed across the strains and some anaerobic yields are not fully captured in the by-products measured. This is likely due to CO2 evolution from formate dehydrogenase.