
Figure 2. Computationally determined high flux reactions from physiological data.
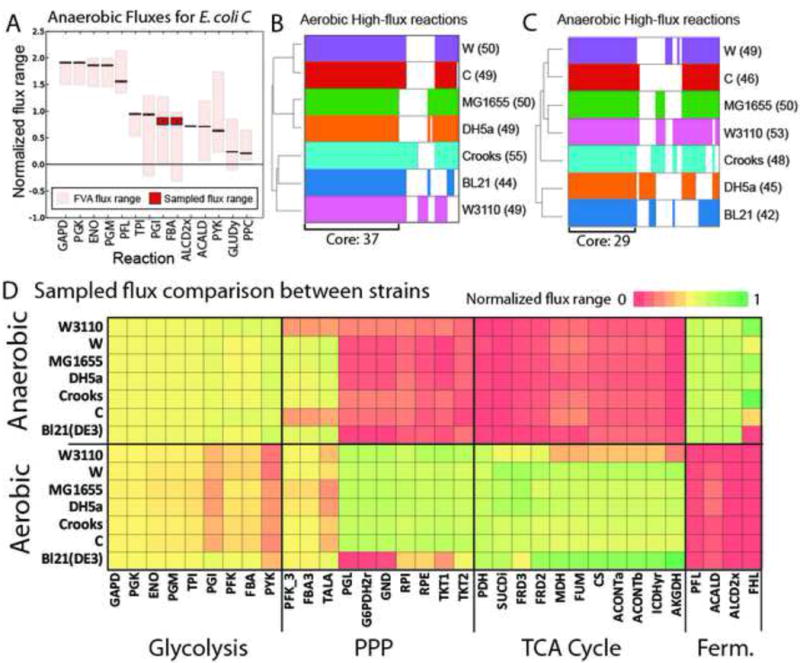
A) Each strain-specific model was constrained using measured physiological data. Flux variability analysis and sampling were performed on each constrained model. All fluxes were normalized to glucose uptake rate and sorted by mean sampled flux value. All graphs for each strain and each growth condition are available in Figure S7. The absolute values of normalized flux values were log transformed. High flux reactions were determined to be those reactions with sampled-flux values greater than 1.5 standard deviations above the mean of all sampled flux values. B and C) High flux reactions for each strain were clustered and plotted. The counts of high flux reactions for each strain are indicated next to the strain name in parentheses. Shared (core) and unique high flux reactions for each strain are shown for aerobic and anaerobic conditions. D) Sampled flux values were compared between the strains in aerobic and anaerobic conditions to highlight condition- and strain-specific behaviour. Reaction abbreviations are given in Data S3.