
Figure 3. Gene expression analysis.
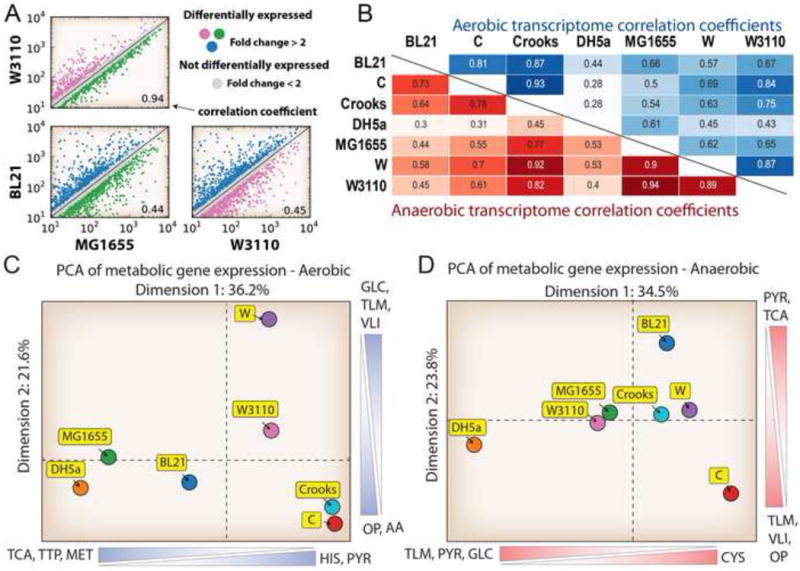
A) Example of a comparison of the transcript levels between strains W3110, MG1655, and BL21, as well as their correlation coefficient. Strains MG1655 and W3110 have a 0.94 correlation coefficient for expression of shared genes. In contrast, strain BL21 shows divergent gene expression compared to strains MG1655 and W3110 with a much lower correlation coefficient of 0.44 and 0.45, respectively. B) The pairwise correlation coefficients for each strain in both aerobic (top, green) and anaerobic (bottom, red) conditions. C) PCA plot of expression values for shared metabolic gene expression between strains aerobically and D) anaerobically. Scale bars represent metabolic subsystems that majorly contribute to the given dimension. Abbreviations: TCA: Citric Acid Cycle, APM: Arginine and Proline Metabolism, GLC: Glycolysis/Gluconeogenesis, MET: Methionine Metabolism, HIS: Histidine Metabolism, OP: Oxidative Phosphorylation, TLM: Threonine and Lysine Metabolism, VLI: Valine, Leucine and Isoleucine Metabolism, PYR: Pyruvate Metabolism, TTP: Tryptophan, Tyrosine and Phenylalanine Metabolism, AA: Aspartate and Alanine Metabolism.