
Figure 4. A comparison of high flux reactions and highly expressed metabolic genes.
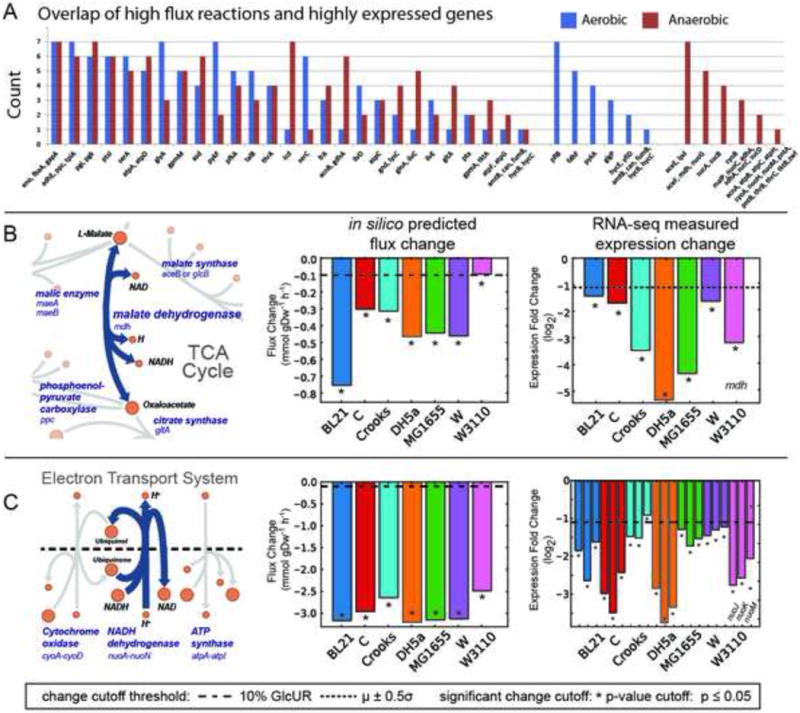
A) The occurrence of a given gene and the reaction it catalyses falling in the intersection of both high flux and highly expressed sets for the seven strains examined. Several pathways are enriched in this intersection set (e.g., lower glycolysis). Genes were grouped if they had identical counts under aerobic and anaerobic conditions. There were several genes that were in this intersection exclusively for aerobic or anaerobic conditions (right side of graph). B & C) The measured physiological data was integrated with genome-scale models to predict changes in gene expression during a shift from aerobic to anaerobic conditions. Shown are two examples for (B) malate dehydrogenase (MDH) and (C) the Electron Transport System. A map is shown of the predicted reaction and its neighbours (left) along with the prediction of the intracellular flux change between aerobic and anaerobic conditions (middle). The actual measured fold change in expression is graphed (right) for comparison with model-predicted flux changes (dashed lines indicate a threshold for minimum magnitude and * indicates significance for the predicted and measured changes). The example for prediction of mdh (B) demonstrates that the model correctly predicts a change in expression; all 7 models predicted a change in MDH flux that exceeded the minimum threshold and the measured expression change of mdh in each strain was large and significant. The nuo genes (C) that catalyse the NADH dehydrogenase reaction also demonstrate good model-based prediction of expression change.