
Figure 5. Strain-specific production potential.
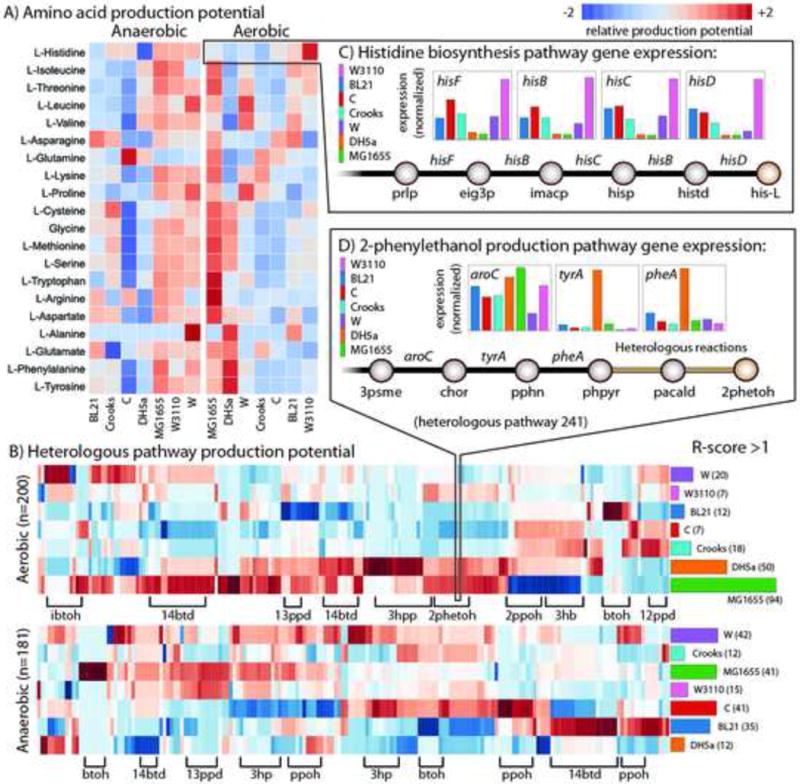
The product potential for targeted metabolites was evaluated based on native gene expression for high yield pathways of interest measured using RNAseq and genome-scale modelling (see main text and STAR Methods). A) A heat map displaying the relative production potentials for all 20 amino acids (left axis) for each strain (bottom axis) in aerobic and anaerobic conditions. Red indicates the highest potential and blue the lowest (see legend). B) A heat map of the relative production potential for 245 and 200 viable heterologous pathways in aerobic (top) and anaerobic (bottom) conditions, respectively. Heterologous pathways are clustered (columns) based on the target product (there can be many compounds for a given compound) and some of the most abundant are labelled on the bottom axis. The right axis shows a plot of the number of instances where each strain has an ‘R-score’ (relative production potential score, see STAR Methods) > 1. C) Example demonstrating the production potential for histidine biosynthesis. Shown are the final five reaction steps and relative expression levels of their catalysing genes for each strain. Strain W3110 (pink) has greater gene expression of these his operon genes, making it particularly well suited to produce histidine. D) A similar example demonstrating production potential for heterologous production of 2-phenylethanol. Here, the last three steps (before the heterologous pathway) are shown with their relative native expression levels. This heterologous pathway branches from phenylpyruvate (phpyr), an intermediate of tyrosine biosynthesis. DH5a has high native expression of these 3 steps along with others in the pathway. All metabolite abbreviations are listed in Data S3. The scores for each product and contributing expression values and flux profiles are available in Data S15.