
Figure 2. Meta-analyses of synapse numbers in the hippocampus, frontal cortex and C,E,T.
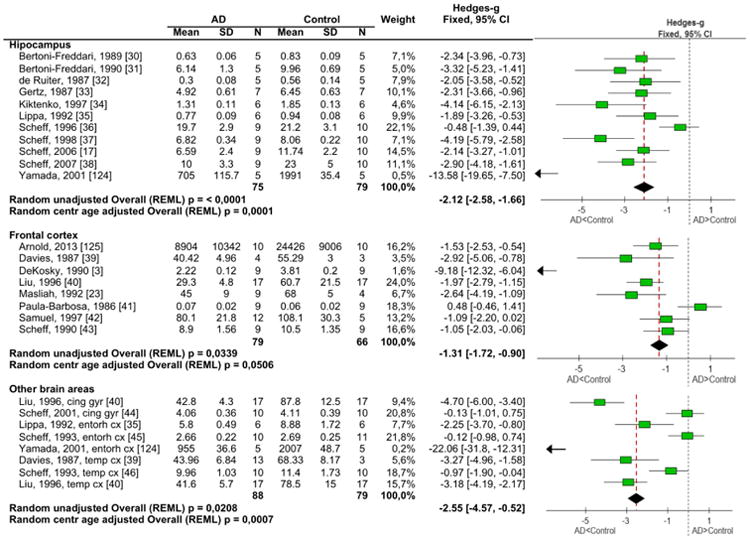
Information extracted from the manuscripts for the meta-analysis of synapse numbers in the different brain regions along with the forest plot of the standard mean differences.