
Figure 3. Pre- and postsynaptic marker changes in different brain areas.
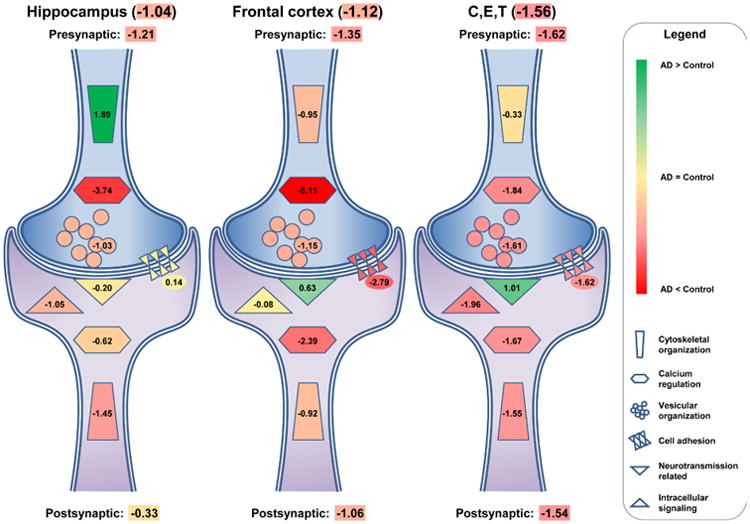
Schematic representation of the standard mean differences (SMD) for pre-and postsynaptic markers in the hippocampus, the frontal cortex, C,E,T (cingulate gyrus, entorhinal cortex and temporal cortex) and the remaining. Presynaptic markers are more affected by AD than the postsynaptic markers in all areas observed. These differences vary by brain area with the hippocampus showing the greatest difference and the C,E,T showing the smallest difference. SMD's are listed in each summarizing structure, for the overall pre- and postsynaptic change and for the overall change per brain area. Green-to-red color change depicts an increase or decrease of synaptic markers in comparison to healthy controls, where more green indicates stronger increase and more red stronger decrease.