. 2016 Jun 9;7(9):6132–6140. doi: 10.1039/c6sc01469k

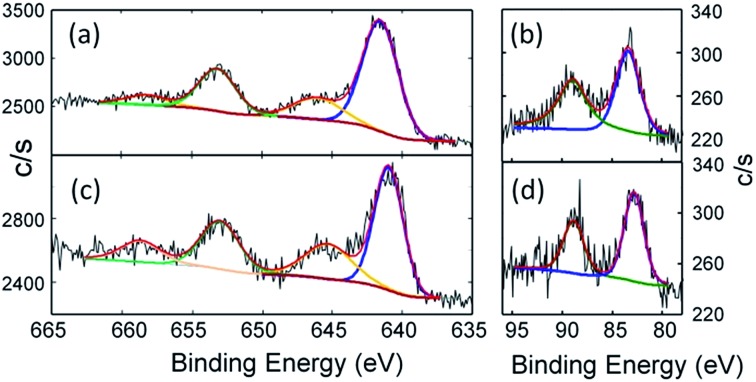
Fig. 4. High-resolution Mn 2p spectra of (a) PhB(MesIm)3Mn Created by potrace 1.16, written by Peter Selinger 2001-2019 N (2) and (c) PhB(MesIm)3MnCl (1). The black line represents the experimental data, the red line shows the fit, and the blue and green lines represent Mn 2p3/2 and Mn 2p1/2 components, respectively, while the brown line represents shake-up satellites. See Table S3 for fitting parameters. High-resolution Mn 3s spectra of (b) PhB(MesIm)3Mn Created by potrace 1.16, written by Peter Selinger 2001-2019 N (2) and (d) PhB(MesIm)3MnCl (1). The black line represents the experimental data, the red line shows fit, and the blue and green lines represent Mn 3s split components. See Table S4 for fitting parameters.

Fig. 4