Figure 5.

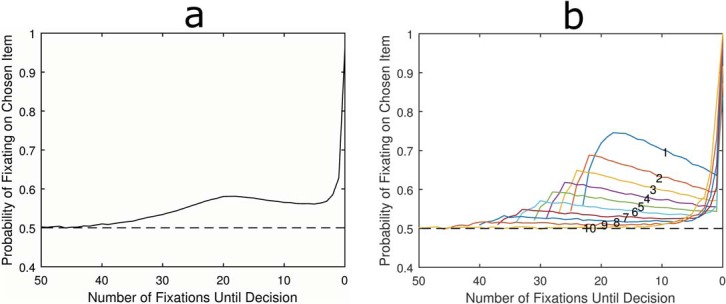
Average LOB for absolute threshold model with mutual inhibition (a) and the LOBs from the same model when simulations are split into deciles by RT. See the online article for the color version of this figure.

Average LOB for absolute threshold model with mutual inhibition (a) and the LOBs from the same model when simulations are split into deciles by RT. See the online article for the color version of this figure.